A leveraged buyout (LBO) is the purchase of a company using a modest amount of equity and a large amount of borrowed money, with the debt secured by and repaid from the target company's own cash flow. The sponsor earns its return when it sells the company: exit value minus the remaining debt, compared with the equity it put in. The example below works through every step with real arithmetic, from sources and uses to IRR.
The mechanics matter because they decide outcomes. In 1982 Wesray bought Gibson Greetings from RCA for about $80 million using roughly $1 million of equity, and the IPO came about 16 months later. That deal, more than any textbook, taught Wall Street what leverage could do to an equity return. The same arithmetic, run in reverse, explains why buyouts such as TXU lost everything. Here is how it works.
How does a leveraged buyout work?
Four features define an LBO, as the leveraged buyouts study sets out:
- Control passes to a financial sponsor, usually 51% to 100% of the equity.
- Debt funds a large share of the price, typically 40% to 65% today and as much as 80% to 90% in the 1980s.
- The target's assets and cash flows secure that debt, not the sponsor's balance sheet. The fund is not liable if the company defaults.
- A planned exit within about three to seven years turns the equity back into cash.
Leverage does two jobs. It magnifies equity returns, because all of any rise in company value goes to the thin equity slice. And it imposes discipline: Michael Jensen argued in his 1989 Harvard Business Review essay "Eclipse of the Public Corporation" that mandatory interest payments stop managers from wasting cash. Both effects reverse when things go wrong.
Step 1: Set the entry price
The worked example uses "Project Keystone," a hypothetical business-services company from the research behind The Ownership Equation. All figures are in millions of dollars.
| Assumption | Value |
|---|---|
| Revenue (last twelve months) | $500.0 |
| EBITDA margin | 20.0% |
| EBITDA (after quality-of-earnings review) | $100.0 |
| Entry multiple (EV / EBITDA) | 11.0x |
| Purchase enterprise value | $1,100.0 |
| Transaction fees | 1.5% of EV = $16.5 |
| Financing fees | 2.0% of debt = $11.0 |
| Holding period | 5 years |
The EBITDA figure is the one that survived diligence, not the seller's adjusted number. That distinction can move the price by tens of millions of dollars, as our guide on how private equity values companies shows.
Step 2: Build the capital structure
| Tranche | Amount | Multiple of EBITDA | Rate | Repayment |
|---|---|---|---|---|
| Revolving credit facility ($100 limit) | $0 drawn | n/a | SOFR + ~300 bp | For liquidity only |
| Term Loan B (first lien, floating) | $400.0 | 4.0x | 7.50% | 1% a year plus 100% cash sweep |
| Senior unsecured notes (fixed) | $150.0 | 1.5x | 8.25% | Repaid at maturity in year 8 |
| Total debt | $550.0 | 5.5x | ~7.70% blended |
The term loan is "covenant-lite," meaning it has no quarterly financial maintenance test. The revolver has a springing covenant that applies only if it is drawn above about 35%. The terms of the debt matter as much as the amount, a point Chapter 8 develops in detail.
Step 3: Sources and uses
Sources and uses is the table every deal starts with. The uses are what the money pays for. The sources are where it comes from. Sponsor equity is the "plug" that makes them balance.
| Uses | $m | Sources | $m |
|---|---|---|---|
| Purchase enterprise value | 1,100.0 | Term Loan B | 400.0 |
| Transaction fees | 16.5 | Senior notes | 150.0 |
| Financing fees | 11.0 | Sponsor equity | 577.5 |
| Total | 1,127.5 | Total | 1,127.5 |
Equity is 51.2% of the total, typical for 2023–26. Including fees, the sponsor is effectively paying 11.28 times EBITDA.
Step 4: Project the business and its free cash flow
The operating assumptions are deliberately plain: revenue grows 6% a year, the EBITDA margin rises 40 basis points a year to 22% by year five through pricing and procurement work, capex is 3.5% of revenue, working capital is 10% of revenue, and cash taxes are 25%.
| $m | Year 1 | Year 2 | Year 3 | Year 4 | Year 5 |
|---|---|---|---|---|---|
| Revenue | 530.0 | 561.8 | 595.5 | 631.2 | 669.1 |
| EBITDA | 108.1 | 116.9 | 126.3 | 136.4 | 147.2 |
| Interest | (42.4) | (40.0) | (37.1) | (33.5) | (29.3) |
| Cash taxes | (12.5) | (15.0) | (17.8) | (21.0) | (24.5) |
| Capex | (18.6) | (19.7) | (20.8) | (22.1) | (23.4) |
| Change in working capital | (3.0) | (3.2) | (3.4) | (3.6) | (3.8) |
| Free cash flow | 31.7 | 39.0 | 47.1 | 56.2 | 66.2 |
| FCF as % of EBITDA | 29% | 33% | 37% | 41% | 45% |
Notice the last line. Cash conversion rises every year because interest falls as debt is repaid, which frees more cash to repay more debt. Practitioners call this the deleveraging flywheel. It is also why EBITDA alone is a poor guide: interest, taxes, capex and working capital absorb more than half of year-one EBITDA before a dollar of debt is repaid.
Step 5: Run the debt schedule
All free cash flow goes to the term loan. The notes cannot be repaid early.
| $m | Year 1 | Year 2 | Year 3 | Year 4 | Year 5 |
|---|---|---|---|---|---|
| Term loan, end of year | 368.3 | 329.3 | 282.1 | 225.9 | 159.7 |
| Senior notes | 150.0 | 150.0 | 150.0 | 150.0 | 150.0 |
| Total debt | 518.3 | 479.3 | 432.1 | 375.9 | 309.7 |
| Debt / EBITDA | 4.79x | 4.10x | 3.42x | 2.76x | 2.10x |
| EBITDA / interest | 2.55x | 2.92x | 3.41x | 4.07x | 5.02x |
Over five years the company repays $240.3 million, exactly its cumulative free cash flow. Leverage falls from 5.5x to 2.1x. A simplification worth flagging: the model charges interest on beginning-of-year balances to avoid the circular reference a production model handles with average balances.
Step 6: Calculate the exit and the returns
Assume the company sells at the end of year five at the same 11.0x multiple it was bought for. No multiple expansion is assumed in the base case.
| Exit bridge | $m |
|---|---|
| Year 5 EBITDA | 147.2 |
| × Exit multiple | 11.0x |
| Exit enterprise value | 1,619.3 |
| − Remaining debt | (309.7) |
| Equity value to sponsor | 1,309.5 |
MOIC (multiple on invested capital) = 1,309.5 ÷ 577.5 = 2.27x.
IRR, with one outflow and one inflow, is MOIC raised to the power of one over the number of years, minus one: 2.27^(1/5) − 1 = 17.8%.
Real life takes some of that away. Exit fees, management incentive plan dilution and call premiums are excluded. A 7.5% management pool on the $732 million gain alone would cost about $55 million and about one point of IRR.
Where did the $732 million gain come from?
| Source | Calculation | $m | Share |
|---|---|---|---|
| EBITDA growth | (147.2 − 100.0) × 11.0 | 519.3 | 70.9% |
| Multiple expansion | (11.0 − 11.0) × 147.2 | 0.0 | 0.0% |
| Debt paydown | 550.0 − 309.7 | 240.3 | 32.8% |
| Fees | (27.5) | (3.8%) | |
| Total | 732.0 | 100% |
The margin program alone is worth about 3.4 points of IRR. Run the model with flat 20% margins and the result falls to 1.96x and 14.4%. That is the assumption an investment committee should test hardest in diligence.
Leverage, by contrast, adds about 5.5 points. Buying the same company with no debt produces 1.79x and 12.3%. The sponsor earns that extra return by carrying the risk visible in year one: debt at 4.8 times EBITDA and interest covered only 2.6 times.
What changes the result most?
The research's sensitivity tables isolate one input at a time.
| Change | IRR | MOIC |
|---|---|---|
| Base case (11x in, 11x out, 6% growth) | 17.8% | 2.27x |
| Exit at 10x instead of 11x | 15.0% | 2.01x |
| Exit at 12x | 20.3% | 2.52x |
| Revenue growth 2% instead of 6% | 11.4% | 1.72x |
| Pay 12x at entry, exit at 11x | 14.0% | n/a |
| Worst cell tested (2% growth, 9x exit) | 5.3% | 1.30x |
Three lessons follow. Paying one extra turn at entry costs about 3.8 points of IRR, roughly the same as losing a full turn at exit. That is the arithmetic behind "you make your money when you buy." Second, at 2024–26 interest rates, extra leverage is a weak return lever and a strong risk lever: moving from 5.5x to 6.5x debt adds only about 2 points of IRR while year-one interest coverage falls toward 2.0x. Third, no cell in the grid loses money. That resilience, not the base-case IRR, is what the committee is really buying. Chapter 9 of the book frames underwriting around exactly this question.
How to do a paper LBO in five minutes
Senior investors rarely open the spreadsheet first. A standard prompt: a company has $50 million of EBITDA, you buy it at 10x with 5x debt, EBITDA grows to $70 million over five years, $100 million of free cash flow repays debt, and you exit at 10x.
- Entry: enterprise value $500 million, debt $250 million, equity $250 million.
- Exit: enterprise value $700 million, debt $150 million, equity $550 million.
- MOIC: 550 ÷ 250 = 2.2x. IRR: about 17%.
Memorize three anchors for a five-year hold: 2.0x is about 15% IRR, 2.5x about 20%, 3.0x about 25%. Then say the attribution out loud: $200 million from EBITDA growth and $100 million from debt paydown, so two-thirds operations and one-third deleveraging.
When the LBO arithmetic turns against you
The same leverage that lifted Keystone's IRR by 5.5 points works in reverse. The research gives a simple illustration: a business levered at 6 times whose EBITDA falls 30% is suddenly levered at about 8.6 times, with no change in its debt. That is how KKR and its partners lost about $8 billion of equity at TXU, and how the Toys "R" Us sponsors lost theirs. Our list of the biggest leveraged buyout failures shows the pattern across a dozen deals. Blackstone's Hilton deal shows the other side: a capital structure that could be extended bought the time for the operating plan to work.
The takeaway
An LBO is simple arithmetic with severe consequences: equity is what remains after debt, so every change in earnings or valuation multiple hits the equity harder than the business. In the Keystone example, earnings growth delivered about 71% of the gain, debt paydown about a third, and leverage added about 5.5 points of IRR in exchange for thin early coverage. Price, financing, operations and exit each moved the result, which is why the four factors multiply rather than add. For the broader business model, read our guide to how private equity makes money. For the full underwriting framework, see Chapter 9 of The Ownership Equation and the LBO modeling and valuation study.
Frequently asked questions
How much debt is used in a typical LBO today?+
In the 2023 to 2025 market, large buyouts typically carried about 5 to 6 times EBITDA of debt, and equity made up about 45% to 55% of the capital. In the 1980s equity was often only 5% to 20% of the price.
What IRR do private equity firms target on an LBO?+
Large-cap buyouts historically targeted about 20% to 25% gross IRR. With higher interest rates and higher prices in 2023 to 2026, many large funds underwrite high-teens gross IRR and about 2.0x to 2.5x the money.
What is a paper LBO?+
A paper LBO is a back-of-the-envelope version of the model done in a few minutes with round numbers. Senior investors use it to decide whether a deal deserves a full model, and megafunds use it as a standard interview test.
Why does paying a higher entry multiple hurt returns so much?+
Every extra turn of EBITDA paid at entry must be earned back through growth, debt paydown or a higher exit multiple. In the worked example, paying 12x instead of 11x cuts the base-case IRR from about 17.8% to about 14.0%.
Go deeper in The Ownership Equation
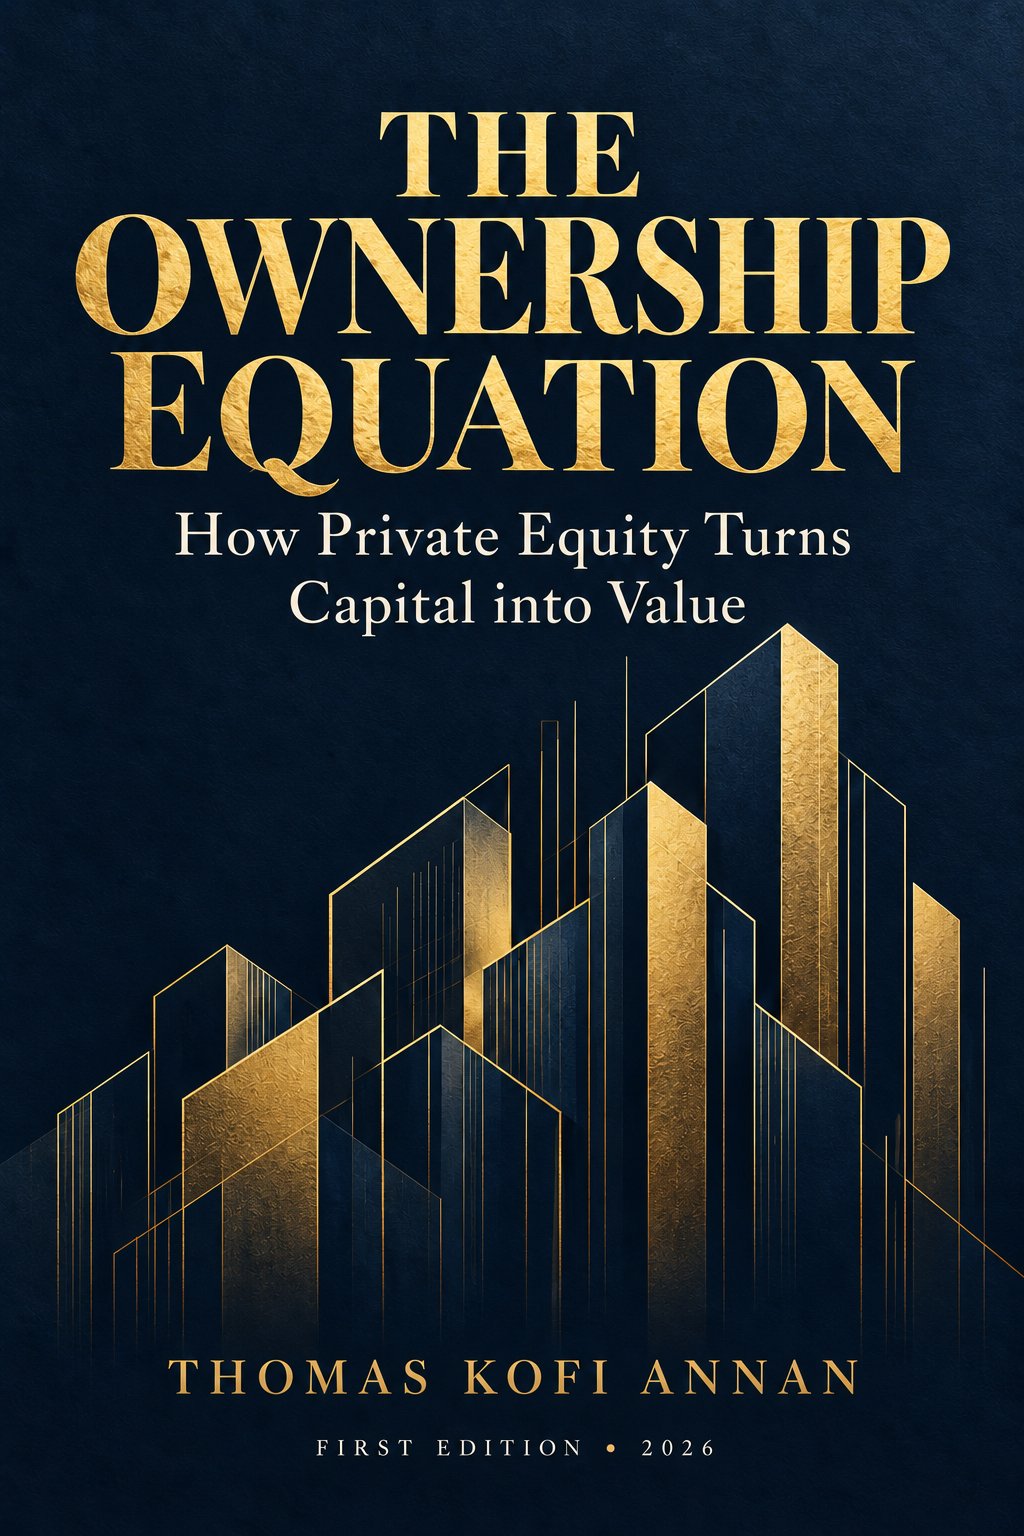
From the research behind The Ownership Equation
How Private Equity Turns Capital into Value
25 chapters, 22 industry studies, 92 firms and 924 strategic moves.
See the bookEducational content, not investment, legal, tax, medical or engineering advice. Figures marked “reported” come from filings and published sources that have not been independently audited.