The Equation Series
Menu
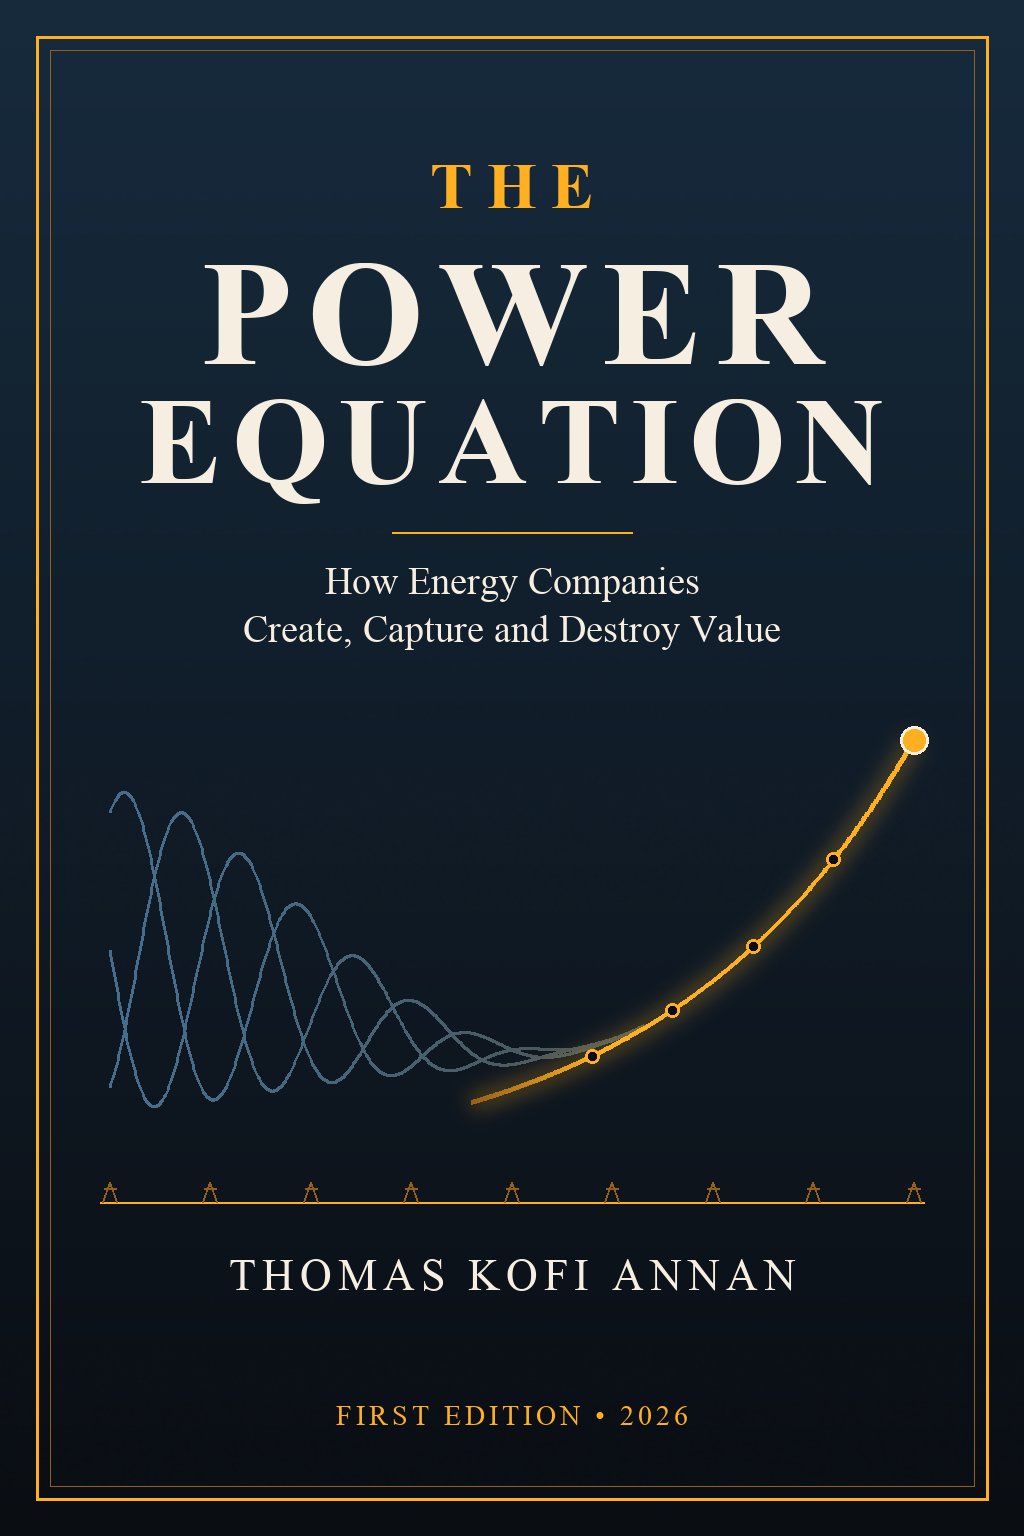
The Power Equation cover

Energy · Volume 4 of the Equation Series

The Power Equation

How Energy Companies Create, Capture and Destroy Value
By Thomas Kofi Annan · First edition, 2026

In the spring of 2026 the energy industry was reminded, twice, what it sells. 41 on 30 April. Producers whose oil could reach the sea by another route were suddenly worth more than producers with cheaper barrels and no way out. Read more

25
chapters
24
industry studies
100
companies
885
moves

Complete EditionBest value

Everything above, at the best price

PDF + EPUB + M4B

$99

Buy Complete Edition

The Book

25 chapters · ~73,000 words

PDF + EPUB, plus the narrative edition

$29

Buy The Book

Research Companion

24 studies · 100 profiles · 885 moves · ~1.5 million words

PDF + EPUB, plus the narrative edition

$59

Buy Research Companion

Audiobook

159 hr 20 min across 4 volumes

M4B (chaptered)

$39

Buy Audiobook

From the preface

The power equation

In the spring of 2026 the energy industry was reminded, twice, what it sells. After US–Israeli strikes on Iran at the end of February, traffic through the Strait of Hormuz was effectively halted from early March, QatarEnergy declared force majeure on its liquefied natural gas, and Brent crude rose above $115 a barrel in March, reaching a reported high of $126.41 on 30 April. Producers whose oil could reach the sea by another route were suddenly worth more than producers with cheaper barrels and no way out. At the same time, in the United States, the grid operator for thirteen states and Washington, D.C., was paying about $329 per megawatt-day for capacity in 2026/27, against about $29 two years earlier, because technology companies building data centres needed power that could run every hour and a connection to deliver it. Owners of old nuclear plants signed twenty-year contracts with Microsoft, Amazon and Meta. Some of the industry's money in those years created more value, for more people, than almost any other business: the price of a battery pack fell by about nine-tenths between 2010 and 2025, and that of a solar module by more. Much of it was destroyed: two nuclear units in Georgia that cost about $35 billion and came in seven years late, offshore wind farms cancelled after their contracts were signed, a European battery champion that raised more than $13 billion and went bankrupt, and a week of Texas winter that left a co-operative with a power bill several times its annual revenue.

The difference is rarely the quality of the resource or the engineering. This book argues that an energy company creates durable value only when four things are true at once, and that the factors multiply rather than add: if any is zero, the result is zero. It must have supply at a cost the market will pay, a resource, plant, machine or service that delivers energy, or the equipment for it, below the price buyers will pay across the cycle, not just at the top of it. It must have a route to market, an offtake contract, pipeline, grid connection, rate base or customer base that turns production into revenue, because stranded supply is worth nothing. It must have capital matched to the asset, financing whose cost, term and structure fit an asset that is paid for up front and earns over decades, strong enough to survive the low point of the cycle. And it must hold a licence to operate, the permits, regulatory approvals, safety record and public consent that let it build and keep running. Around those four factors sit two forces that no company controls, commodity prices and politics, from OPEC+ quotas and wars to tax credits granted and withdrawn, which behave like weather: they do not decide whether a project is sound, but they decide how long an unsound one survives, and they can bankrupt a sound one financed for fair weather only. Most of the failures in this book come from treating one factor as proven because another was: cheap capital mistaken for low cost, a subsidy mistaken for a market, a licence mistaken for permanent.

The twenty-five chapters develop that view in seven parts. Part I explains why energy is not just a commodity, how it became a business from Titusville and Pearl Street to the Seven Sisters and Enron, how the money from one barrel and one kilowatt-hour is divided along the chain, and why reserves and capacity figures are weaker evidence than they look. Part II follows the markets one by one: oil and gas, LNG and pipelines, utilities and grids, wholesale power markets, solar and wind, batteries and electric vehicles, and nuclear. Part III examines what it takes to build things that work: the economics of a power plant, offtake contracts, project finance and the cost of capital, trading and risk, distributed energy and the customer, and safety. Part IV covers the capital cycle, policy and subsidy from the Inflation Reduction Act to its 2025 rollback, geopolitics and energy security, the transition bet, and energy in emerging markets, Africa above all. Part V turns to people: leadership, culture and capital allocation, and how to build an energy company. Part VI reads five cases for the decisions behind them, and the Practical Reference supplies worked examples, checklists, a glossary and a guide to the evidence. Each chapter opens with a documented case, explains the mechanics it illustrates, works one stylized example and closes by naming the factor of the equation on which its case turned.

The book · ~73,000 words

Contents

Each chapter has a free preview of its opening and section list.

Energy Research Companion · Part I

24 industry studies

The companion opens with an in-depth study of each part of the industry, backed by 24 technical exhibits: worked examples, diligence checklists and case studies.

01Oil and Gas Upstream: Exploration and ProductionThe upstream business finds oil and gas, proves that it can be produced, builds the wells and facilities to produce it, and sells it at a price nobody in the business controls. It is the largest single pool of profit in energy and the most cyclical: the same barrel sold for a negative price on 20 April 2020 (WTI's May contract settled at −$37.63/bbl) and for more than $115/bbl on Brent in March 2026, when the war with Iran effectively closed the Strait of Hormuz (reported). Two facts organise the industry. First, its central asset is a forecast: reserves are estimates of what can be produced from rock no one can see, and whether they are reported under the US Securities and Exchange Commission's rules or the industry's Petroleum Resources Management System (PRMS) changes the number. Second, every barrel has a place on a cost curve: Gulf onshore fields that cost a few dollars a barrel to lift, Guyana and Brazilian pre-salt deepwater developments with full-cycle breakevens reported at ~$30–40/bbl Brent, US shale wells that need ~$60–70/bbl WTI to justify drilling a new well (Dallas Fed survey, 2025, reported), and older, costlier barrels that survive only in high-price years. Upstream value is created when a company holds barrels low on that curve, develops them on time and budget, under fiscal terms that leave it a fair share, with a licence that lasts; it is destroyed by buying acreage at the top of the cycle, by overstated reserves, and by projects that arrive late into a price collapse. This section explains reserves and resources, exploration risk, the three main resource types (conventional, deepwater, shale), decline curves, breakevens, fiscal regimes (royalties, taxes and production-sharing contracts), the split between international and national oil companies, and the oilfield-services industry. A worked example models a deepwater development under a PSC and under a royalty-and-tax regime; a checklist covers diligence on reserves and E&P companies.+ 2 exhibits02Midstream: Pipelines, LNG and StorageMidstream is the part of the energy business that moves and stores molecules: gathering lines from wells, long-distance pipelines for crude, products and gas, storage caverns and tank farms, processing plants that strip liquids from gas, and the liquefied-natural-gas (LNG) chain that turns gas into a seaborne commodity. Its economic model is the toll road: earn a fee per unit moved or stored, preferably under long-term contracts that pay whether or not the capacity is used, so that the owner is paid for access rather than exposed to the commodity price. Done well, it is the most bond-like business in energy; done badly — financed with too much debt, or built on volume rather than contracts — it is a leveraged bet on the cycle, as the US master-limited-partnership (MLP) crash of 2014–16 and Kinder Morgan's ~75% dividend cut of December 2015 showed. Midstream is also where route to market is created or destroyed: stranded gas is worthless until a pipeline or LNG plant reaches it, and the 2022 loss of Russian pipeline gas to Europe and the 2026 Hormuz closure (which stopped Qatar's LNG for months) re-priced every alternative route. US LNG export capacity has grown from zero in early 2016 to exports averaging ~17.4 bcf/d in H1 2026 (EIA), making the United States the world's largest LNG exporter, with Henry Hub gas at ~$3/MMBtu sold into markets paying many times that. This section explains pipeline economics and regulation, the MLP model and its unwinding, gas storage, the LNG chain from liquefaction to regasification, how LNG is contracted (long-term SPAs versus spot), shipping, the Henry Hub–TTF–JKM spreads, and the licence fights that decide which pipelines get built.03Downstream: Refining, Petrochemicals and FuelsCrude oil is useless until it is refined. Downstream is the business of turning crude into gasoline, diesel, jet fuel, naphtha, liquefied petroleum gas, asphalt and petrochemical feedstocks, and of selling those fuels to motorists, airlines, ships and factories. Its economics are a spread: a refiner buys crude and sells products, and its margin is the difference — the crack spread — less the cost of running a plant that operates continuously, is dangerous, needs constant maintenance and lasts half a century. That spread is set by global product markets, not by the refiner, and swings from near zero (2020, when demand collapsed) to record highs (2022, when diesel cracks above $60/bbl followed Russia's invasion of Ukraine; reported). Three structural shifts define the 2020s. First, capacity is moving east and south: new mega-refineries in China, India, the Middle East and Africa — above all Dangote's ~650,000 b/d Lekki refinery in Nigeria, which by 2026 was running at or above nameplate and had turned Nigeria into a net petrol exporter (reported) — while old plants in Europe and California close; California lost ~17% of its refining capacity with the shutdowns of Phillips 66's Los Angeles refinery (late 2025) and Valero's Benicia refinery (early 2026) (Argus, reported). Second, petrochemicals were meant to be the growth market as fuel demand peaks, and instead a Chinese capacity wave crushed margins from 2023. Third, policy made new fuels: US renewable-fuel mandates and credits (RINs, the 45Z credit), state low-carbon fuel standards and EU mandates created a renewable-diesel and sustainable-aviation-fuel industry whose profits depend almost entirely on regulation. This section explains refinery configuration and complexity, crack spreads and margins, closures and new builds, petrochemicals, fuel retail, biofuels and RINs, and how to read downstream numbers.04Electric Utilities, Grids and Rate RegulationAn electric utility is a business whose price is set by the government. In return for a monopoly over the wires, and often over generation, in a territory, it accepts an obligation to serve every customer and lets a regulator decide what it may charge. The regulator does not set a profit; it sets a revenue requirement: operating costs, depreciation and taxes recovered at cost, plus a return on the money invested in the network (the rate base) at an allowed return on equity (ROE) that averaged ~9.77% in US electric rate cases in 2025 and ~9.79% in the first half of 2026 (S&P Global Regulatory Research Associates, excluding limited-issue riders; reported). That formula explains almost everything about the industry: a utility grows its earnings by growing the rate base, so its management is paid to spend capital; its investors treat it as a bond with a growth kicker; and the binding constraint is not demand or technology but what customers and their elected representatives will tolerate on the bill. By 2025–26 that constraint was being tested from three directions at once: a capital-spending wave (US investor-owned utilities projected ~$208bn of capex in 2025 and more than $1.1 trillion over 2025–29; Edison Electric Institute, Oct 2025), the first sustained load growth in two decades (data centres above all), and liability for wildfires and storms large enough to bankrupt a utility (PG&E, 2019) or drain a state fund (the Eaton fire, Jan 2025). This section explains how utilities are structured and regulated, how a rate case turns capital into price, why the capex wave and load growth push bills in opposite directions, how liability became an existential cost, why utility M&A came back in 2025–26, and how the same model works, or fails, outside the US. Two companion files give a stylized revenue-requirement and bill-impact worked example and a checklist for reading a rate case.+ 2 exhibits05Power Markets: Wholesale Electricity and CapacityElectricity is the only major commodity that must be produced at the instant it is consumed, everywhere on a network, with almost no storage between the two. That physical fact shapes every market built around it. Since the late 1990s about two-thirds of US electricity load, and almost all of Europe's, has been priced in organised wholesale markets run by independent system operators (ISOs and RTOs in the US; exchanges and transmission operators in Europe). Their core mechanism is the merit order: generators are dispatched from cheapest to dearest, and every one is paid the price of the last unit needed, the marginal price. Because the marginal unit is usually a gas plant, power prices track gas prices, which is why Europe's gas crisis of 2022 became a power crisis and why the 2026 Gulf crisis pushed European power prices up again. Because wind and solar have near-zero running costs, they push the marginal price down, sometimes below zero, and erode their own revenues. And because prices in most hours are too low to pay for plants that run only in a few, markets must solve a second problem: resource adequacy, having enough capacity for the worst hour of the year. Texas (ERCOT) relies on scarcity prices in an energy-only market; PJM and others pay generators in capacity auctions, whose prices rose from ~$28.92/MW-day (2024/25) to the cap of ~$325–333/MW-day (2026/27 to 2028/29) as data-centre load forecasts arrived (PJM, reported). Winter Storm Uri (Feb 2021) showed what happens when an energy-only market's scarcity price meets a physical failure. This section explains how the markets work, how prices are formed in each time frame, how adequacy is paid for, what ancillary services and negative prices are, how retail choice sits on top, who makes money, and how data-centre load is reshaping market design. Two companion files give a stylized merit-order, price-duration and capacity-auction worked example and a case study of Winter Storm Uri.+ 2 exhibits06Solar Power and the Solar Supply ChainSolar photovoltaics (PV) is the cheapest new source of electricity in most of the world, and it got that way through a manufacturing cost collapse driven mostly by China. The module price that a developer pays fell from several dollars per watt in the late 2000s to ~$0.10/W (China export, 2024) and ~$0.085–0.095/W for Tier-1 TOPCon modules early in 2026 (BloombergNEF via secondary reports; verify), and the International Renewable Energy Agency (IRENA) estimates that the global average cost of electricity from new utility-scale solar fell by ~90% between 2010 and 2023, to ~$44/MWh. The world added ~600 GWdc of solar in 2024 (BloombergNEF and IEA estimates; verify), more than all other power sources combined. Yet the industry that made this possible has repeatedly destroyed its own profits. Chinese manufacturers own more than 80% of every stage of the chain from polysilicon to module, and over 90% of polysilicon and wafers (IEA, 2022–24), and built so much capacity that prices fell below cash cost in 2023–25: LONGi, the world's largest module maker, reported its first annual loss in more than a decade for 2024. In the United States, the opposite problem holds: modules cost two to three times the world price because of tariffs, anti-dumping and countervailing duties (AD/CVD), the Uyghur Forced Labor Prevention Act (UFLPA) and, from 2026, the "foreign entity of concern" (FEOC) rules in the 2025 tax law. Downstream, the economics split three ways: utility-scale plants sold under power purchase agreements (PPAs), commercial and industrial (C&I) systems sold against a business's bill, and residential rooftops sold to households, a segment where finance is the product and where bankruptcies (SunPower 2024, Sunnova 2025) followed the end of retail-rate net metering in California. Finally, solar's success erodes its own value: in sunny markets, midday prices fall towards zero or below, curtailment rises, and the next megawatt of solar earns less than the last unless it is paired with storage (08). This section explains the chain, the technology race, trade policy, the three market segments, cost and value, and how to read solar numbers. Two companion files give a worked payback example for a residential and a C&I system, and a diligence checklist on the supply chain and FEOC rules.+ 2 exhibits07Wind Power, Onshore and OffshoreWind is the second-largest source of renewable electricity after hydro and, onshore, one of the cheapest sources of new energy in windy regions. The world added a record ~117 GW of wind in 2024, ~8 GW of it offshore (GWEC, *Global Wind Report 2025*; verify), most of it in China. Yet the Western wind industry spent 2022–26 in crisis on two fronts. Turbine makers sold machines at fixed prices just before steel, logistics and interest costs jumped, rushed new, larger platforms to market, and paid for it in losses and quality failures: Vestas lost ~€1.6bn in 2022, and Siemens Gamesa's onshore defects led Siemens Energy to a profit warning in June 2023 and a German state-backed guarantee package in November 2023. Offshore developers had bid record-low prices on the assumption of cheap capital; when interest rates and supply-chain costs rose, contracts signed in 2019–21 became loss-making, and Ørsted cancelled its Ocean Wind 1 and 2 projects in New Jersey on 31 October 2023 with ~DKK 28bn of impairments, part of a wave of cancelled US and UK contracts. In the United States a third shock followed: from January 2025 the federal government paused new leasing, revoked or reviewed permits and issued stop-work orders on projects under construction (Empire Wind in April 2025, Revolution Wind in August 2025, and five projects in December 2025), all of which developers fought in court, winning preliminary injunctions by February 2026; the 2025 tax law also cut wind's federal credits short. Meanwhile the UK's January 2026 auction awarded a record ~8.4 GW of offshore contracts at ~£91/MWh (2024 prices), well above earlier rounds, a reset to prices that cover today's costs. This section explains how wind farms make money, turbine OEM economics, the offshore cost-of-capital shock, auction design, US federal actions, ports, vessels and grid connections, and how to read wind numbers.08Energy Storage and BatteriesThe lithium-ion battery is the energy transition's most important manufactured product after the solar module, and it followed the same path: a cost collapse driven by scale, much of it in China, followed by a glut. BloombergNEF's annual survey put the average price of a lithium-ion battery pack at ~$108/kWh in 2025, down 8% in a year and from more than $1,000/kWh in 2010 (real terms); packs for stationary storage fell ~45% in a year to ~$70/kWh, the cheapest segment for the first time, and lithium-iron-phosphate (LFP) packs averaged ~$81/kWh against ~$128/kWh for nickel-manganese-cobalt (NMC) (BNEF, December 2025). Turnkey grid battery systems averaged ~$117/kWh worldwide (BNEF, December 2025), though US prices are higher because of tariffs. Cheaper batteries turned grid storage from a niche into a mass market: the US installed a record ~18.9 GW / ~51 GWh of batteries in 2025 (Wood Mackenzie and ACP; SEIA and Benchmark count ~57.6 GWh), and in California and Texas batteries now routinely supply a large share of the evening peak. But storage is not a source of energy; it is a machine for moving energy through time, and its revenue comes from a stack of services (energy arbitrage, ancillary services, capacity or resource-adequacy payments, contracted tolls) whose prices fall as more batteries are built. Ancillary-service markets saturated first (ERCOT and Great Britain, 2023–25), arbitrage spreads narrow as fleets grow, and capacity accreditation for four-hour batteries falls as their share rises. Safety is the licence: the fire at Vistra's Moss Landing battery building in California on 16 January 2025, in a ~300 MW / ~1,200 MWh installation, forced evacuations and set off a wave of local opposition, and its cause had not been published a year later (reported). This section explains chemistries and cost curves, China's share, the grid-storage revenue stack, capacity accreditation, long-duration storage, safety, recycling and policy. Two companion files give a worked example of a four-hour battery's revenue stack in a capacity market and a storage-project diligence checklist.+ 2 exhibits09Nuclear Power, Fuel and Small Modular ReactorsNuclear power is the energy business with the widest gap between the value of what already exists and the cost of building more. An operating US reactor makes firm, carbon-free electricity around the clock at a capacity factor above 90% for a total generating cost in the low $30s per MWh (industry estimate, Nuclear Energy Institute, 2023, verify), and after 2024 technology companies paid premium prices on 20-year contracts to secure that output: Constellation Energy's restart of Three Mile Island Unit 1 (renamed the Crane Clean Energy Center, ~835 MW) for Microsoft, Talen Energy's 1.92 GW Susquehanna contract with Amazon, Meta's 20-year deal for Clinton. Yet the last two large reactors finished in the United States, Vogtle Units 3 and 4 in Georgia (Southern Company), entered service in July 2023 and April 2024, about seven years late and at more than double the original budget (over $30bn for the two units on most reported bases, ~$35bn including financing costs by some counts, verify basis), while the pair at V.C. Summer in South Carolina was abandoned half-built in 2017 and their vendor, Westinghouse, went bankrupt. Europe's EPRs tell the same story: EDF's Flamanville 3 reached the grid in December 2024 seventeen years after construction began, and Hinkley Point C's cost estimate rose to ~£35bn (reported February 2026, verify money basis) with first power now expected around the end of the decade. Meanwhile China, Russia and Korea build on time often enough to dominate world new build, and the fuel chain (uranium mining, conversion, enrichment, and the high-assay fuel many new designs need) is concentrated in Kazakhstan, Russia and a handful of Western firms. This section explains how an existing reactor earns money and why plants that closed for economic reasons in 2013–2022 became valuable again; life extensions, uprates and restarts; why first-of-a-kind new build destroys capital and what has worked (Barakah, China's series builds); the fuel cycle from mine to fuel assembly, uranium pricing, and Russia's place in enrichment and HALEU; small modular and advanced reactors and the gap between NRC approval and a customer at the price; licensing and the 2025 US executive orders; fusion as a financing story; and the data-centre deals that repriced the fleet. A worked example prices a stylized restart against a stylized first-of-a-kind SMR, and a checklist sets out diligence questions for nuclear projects and companies.+ 2 exhibits10Hydrogen, Fuels and Emerging MoleculesHydrogen is already a ~100-million-tonne-a-year industry, but almost all of it is made from natural gas or coal and used where it has been used for decades: oil refining, ammonia for fertiliser and methanol (IEA, *Global Hydrogen Review*, 2024–25). The idea of the 2020s was to make it clean, from renewable electricity ("green") or from gas with carbon capture ("blue"), and to use it to decarbonise steel, shipping, aviation, heavy trucks and seasonal power storage. Governments committed tens of billions of dollars: the US Inflation Reduction Act's 45V credit of up to $3/kg and seven regional hydrogen hubs with $7bn of federal grants (October 2023), the EU's Hydrogen Bank and renewable-fuel mandates, Japan's ¥3tn contract-for-difference scheme, and Gulf and Australian export projects measured in gigawatts. By 2024–25 the boom had turned into a cull. Announced projects were cancelled or shelved across Europe, Australia and the US because buyers would not pay several times the price of grey hydrogen; Air Products, the industrial-gas company that bet most heavily, replaced its chief executive after a proxy fight and wrote down US projects (February 2025); Plug Power warned on going concern (2023) and Nikola filed for Chapter 11 (February 2025); the US 2025 budget law cut 45V short to projects that begin construction before 2028 (reported, verify); and the Energy Department cancelled the two West Coast hubs' grants in October 2025 (reported). The one giga-scale export project actually under construction, NEOM Green Hydrogen in Saudi Arabia (ACWA Power with Air Products and NEOM, ~$8.4bn), is targeted to start around 2026–27 (reported) with no confirmed buyer beyond its sponsor. This section explains the colours of hydrogen and their costs, electrolysers and China's lead, the US credit and hubs and their 2025 reversal, Europe's and Asia's policy, the export projects, why so many projects failed, and the derivative molecules — ammonia, methanol, e-fuels, sustainable aviation fuel (SAF) and renewable natural gas (RNG) — that often make more sense than hydrogen itself.11Electric Vehicles, Charging and Transport ElectrificationElectric vehicles moved from a niche to about one in four new cars sold worldwide in a decade: more than 20 million electric cars were sold in 2025, roughly a fifth more than in 2024, and the International Energy Agency projected ~23 million (~28% of sales) for 2026 (IEA, *Global EV Outlook 2026*, May 2026). The growth is overwhelmingly Chinese. China made nearly three-quarters of the world's electric cars in 2025, Chinese carmakers accounted for about 60% of global electric-car sales, and a domestic price war led by BYD pushed battery-electric cars below the price of comparable petrol cars in China while crushing the margins of everyone else (IEA; company reports). The United States went the other way: the federal $7,500 purchase credit ended for vehicles acquired after 30 Sep 2025 under the July 2025 budget law, EV sales spiked to more than 10% of new cars in the third quarter of 2025 and then fell to ~6.5% in the third quarter of 2026 (Kelley Blue Book and Electrek estimates, reported), with Tesla holding about half of the shrunken market. Europe sits between, with tightening CO2 rules, tariffs on Chinese EVs from October 2024 and a weak home industry. For the energy business, EVs matter in four ways: as the largest new source of battery demand (see 08), as the main threat to oil demand growth, as a new electricity load that can be managed or can strain distribution grids, and as a charging business that has proved much harder to make profitable than selling cars. This section covers EV cost curves and adoption by market, China's price war, the US credit changes of 2025, the economics of charging and why utilisation is everything, the NACS connector shift, battery swapping a decade after Better Place, fleets, trucks, buses and two-wheelers, the grid and oil-demand effects, and emerging markets.12Data-Centre and AI Power DemandFor fifteen years American utilities planned for flat demand. US electricity use barely moved between about 2007 and 2021 as efficiency offset growth, and utility business plans were built on replacing old plants rather than adding new ones. Data centres for artificial intelligence changed that within about two years. Lawrence Berkeley National Laboratory estimated that US data centres used ~176 TWh in 2023, 4.4% of national electricity, and projected 6.7–12% by 2028 (December 2024); the International Energy Agency put global data-centre use at ~415 TWh in 2024 and projected ~945 TWh by 2030 (*Energy and AI*, April 2025). Those are averages across scenarios that differ by a factor of two, but the local numbers are starker: a single campus may ask for 1 GW at one substation, Texas's grid operator reported ~410 GW of large-load requests by March 2026 against a peak demand record under 90 GW, and Dominion Energy in Virginia reported ~54 GW of data-centre capacity "in various stages of contracting" in October 2026, of which ~12 GW was under signed electric service agreements (reported). This section takes the energy side of the story that AI section 16 tells from the AI side. It covers the load forecasts and why they spread so widely, what a data centre looks like as a load on the grid, how nuclear and gas owners repriced their fleets on hyperscaler contracts (Constellation Energy, Talen Energy, Vistra), the co-location fight at FERC and PJM, large-load interconnection rules (Texas SB 6, PJM's 2026 decision, FERC's June 2026 show-cause orders), behind-the-meter generation, and the question that decides most of the politics: who pays for the grid if the load does not come? In the language of the book's power equation, data-centre demand handed generators a route to market they had lacked for a decade, and made licence to operate — ratepayer consent — the factor most likely to fail.+ 2 exhibits13Grid Equipment, Transmission and InterconnectionElectricity's bottleneck in the 2020s is not fuel or even power plants; it is the equipment and wires between the plant and the customer, and the paperwork that decides who may connect to them. A large power transformer that took about a year to deliver before 2020 took ~128 weeks on average by mid-2025, and generator step-up transformers more than 160 weeks by early 2026 (Wood Mackenzie survey; Reuters, reported). GE Vernova reported a gas-turbine backlog of 64 GW plus 58 GW of slot reservations at the end of September 2026, against factory output of ~20 GW a year (company results, Oct 2026). The United States had ~2,060 GW of generation and storage waiting in interconnection queues at the end of 2025, about twice the country's installed capacity, and the typical project that reached commercial operation in 2025 had spent ~61 months — five years — from request to operation, against ~22 months in 2008 (LBNL, *Queued Up 2026*, reported). Meanwhile the country built very little new high-voltage transmission, and FERC's two big reforms of the period — Order 2023 on interconnection (July 2023) and Order 1920 on long-term transmission planning and cost allocation (May 2024) — were still being implemented and litigated in 2026. This section explains the grid equipment stack and why it ran short, the economics of the turbine and transformer makers (GE Vernova, Siemens Energy, Hitachi Energy, Schneider Electric), high-voltage direct current (HVDC), transmission planning and cost allocation, interconnection queues and their reform, grid-enhancing technologies, the construction workforce (Quanta Services), and how other countries — China's State Grid above all — build faster. In the book's power equation, this is the delivery half of "route to market": a plant with no connection is stranded supply, and equipment makers who were starved of orders for a decade now hold pricing power.14Distributed Energy: Rooftop Solar, Virtual Power Plants and EfficiencyFor a century electricity flowed one way: from a few large plants, over transmission and distribution wires, to customers who paid a regulated tariff and had no say in how it was made. Distributed energy reverses part of that flow. Rooftop solar panels, home and business batteries, electric vehicles, smart thermostats and heat pumps put generation, storage and controllable demand on the customer's side of the meter, and software can aggregate thousands of them into a virtual power plant that a grid operator can dispatch. The business has proved both large and fragile. In the United States, residential solar grew for fifteen years on a federal tax credit, generous net metering and cheap money, then broke in 2023–25: California replaced full retail-rate net metering with a lower export credit (NEM 3.0, effective 15 April 2023), interest rates rose, and the installer-and-lender model that had financed the boom collapsed — SunPower filed for Chapter 11 in August 2024, and the lender Mosaic and the lease provider Sunnova followed in June 2025 (court filings, reported). Then the July 2025 federal law ended the 30% homeowner credit (25D) after 31 December 2025, while leaving a commercial credit available, for a time, to systems owned by third parties and leased or sold by the kWh to households (verify against statute). The survivors, led by Sunrun and Tesla's energy business, are repositioning as owners of fleets of home batteries that can be sold to utilities and grid operators as capacity. Outside the US, rooftop solar has boomed where grid power is expensive or unreliable: Australia, Germany, Pakistan, South Africa and India. This section explains the economics of rooftop solar and why the value of an exported kilowatt-hour decides it; net metering and its reform; how residential solar is financed and why so many companies failed; home batteries; virtual power plants and demand response; heat pumps and electrification; efficiency programmes and their policy supports; and the international picture.15Energy Trading, Commodities and Risk ManagementBetween the well, the mine or the power plant and the final buyer sits a layer of companies that own almost no reserves and make most of their money from moving, storing, blending and pricing energy. In 2022, the year Russia invaded Ukraine, that layer had its best year in history: Vitol, the largest independent oil trader, reportedly earned ~$15bn of net profit, more than many oil majors; Trafigura reported a record ~$7.0bn for its year to September 2022; Glencore, Gunvor and Mercuria also posted records (company reports and press, reported). The same price shock nearly broke Europe's utilities: Dutch TTF gas settled near ~€340/MWh (~$100/MMBtu) in late August 2022, and producers and utilities that had sold their output forward on exchanges faced margin calls in the tens of billions of euros, forcing Germany to rescue and then nationalise Uniper and Nordic governments to offer emergency liquidity lines. Trading is the part of the energy business that turns physical constraints (a full tank in Cushing, a closed pipeline, a cold snap, a ship stuck outside a strait) into prices, and that decides who carries the risk when prices move. This section explains the physical trader's model (arbitrage in space, time and quality, plus logistics and balance sheet), the benchmarks and price-reporting agencies that set the prices everyone else uses, futures, swaps, options and clearing, how producers, utilities and consumers hedge and where basis risk bites, the margin-call crisis of 2022 and the LME nickel squeeze, the financial results of the trading houses through the 2022 peak and the 2024–25 normalisation, the bribery, sanctions and fraud cases that define the industry's licence to operate, and how trading desks measure and limit risk. A stylized worked example prices a contango storage trade and stresses its margin calls; a checklist sets out diligence questions for any trading or hedging business.+ 2 exhibits16Carbon Markets, Carbon Capture and Climate FinanceCarbon dioxide has no natural price. Every attempt to give it one — a cap-and-trade market, a tax, a tax credit for capturing it, a voluntary credit bought by a company with a net-zero pledge, an aid flow from rich countries to poor ones — is a policy construct, and its value to an energy business lasts exactly as long as the policy does. The constructs are now large. The EU Emissions Trading System (EU ETS), the oldest and biggest, put a price on ~40% of the EU's emissions and traded mostly between ~€60 and ~€100 per tonne of CO2 from 2022 to 2026, at ~€82–89/t in October 2026 (ICE Endex prices, reported); from 1 January 2026 its Carbon Border Adjustment Mechanism (CBAM) began charging importers of steel, aluminium, cement, fertiliser, hydrogen and electricity for their embedded carbon. In the United States there is no federal carbon price, but there are state markets (California, Washington, the north-eastern RGGI) and a federal tax credit, 45Q, worth $85 per tonne stored geologically and $180 per tonne for direct air capture — kept, and in one respect enlarged, by the July 2025 law that cut most other clean-energy credits (verify against statute). The voluntary carbon market, where companies buy offsets, shrank after investigations in 2023 found that many rainforest credits did not represent real reductions, and is now rebuilding around integrity labels, removals and the Paris Agreement's new crediting mechanism. And climate finance — the money that is supposed to flow to developing countries — reached a new headline goal of $300bn a year by 2035 at COP29 in November 2024 just before the United States left the Paris Agreement. This section explains how compliance markets work and who wins and loses from them, CBAM and its trade fights, US state programmes, the voluntary market and its integrity scandals, carbon capture and storage (CCS) and its record, direct air capture, methane rules, and climate finance flows to emerging markets, with Africa's position in each.17Energy Finance, Project Finance and ValuationEnergy is the most capital-intensive consumer business in the world. A wind farm, a gas field, a transmission line or a nuclear plant is paid for almost entirely before it earns anything, and then earns slowly for twenty to sixty years. That makes the price of money a cost of energy: in a stylized onshore wind project, raising the cost of debt and equity by about 2.5 percentage points raises the power price the project needs by roughly a quarter, with nothing about the turbines or the wind having changed. This section explains how energy assets are actually financed and valued. It covers non-recourse project finance and how lenders size debt on cash flow (the debt-service coverage ratio, P50 and P99 production cases, sculpting and reserves); tax equity and, since the Inflation Reduction Act of 2022, the transfer market for US clean-energy tax credits (~$42bn of credits transferred in 2025, ~$63bn monetised in total, Crux, reported); yieldcos and why most of them failed or were absorbed; reserve-based lending and net-asset-value (NAV) valuation for oil and gas producers; regulated-utility valuation (rate base × allowed return); the valuation of integrated majors; infrastructure funds; securitisation; and state lenders such as the US Department of Energy's Loan Programs Office. It closes with the cases (SunEdison, Ørsted's 2023 impairments, Vogtle, Hinkley Point C, Kinder Morgan's 2015 dividend cut) that show what happens when the capital does not match the asset, and how an experienced project-finance banker, utility analyst or energy investor reads a deal.+ 2 exhibits18Policy and Regulation: the IRA and the 2025 RollbackIn energy, policy is not background. It is a line in the cash flow, with the government as the counterparty. The Inflation Reduction Act (IRA, signed 16 Aug 2022) turned the US tax code into the world's largest clean-energy subsidy programme. It offered open-ended, ten-year credits for clean electricity (45Y/48E), domestic manufacturing (45X), existing nuclear (45U), clean hydrogen (45V), carbon capture (45Q), clean fuels (45Z) and electric vehicles (30D), and let most of them be sold for cash. Three years later the 2025 budget law (the "One Big Beautiful Bill Act", Public Law 119-21, signed 4 Jul 2025) kept most of the structure but cut it back hard. Wind and solar must now begin construction by 4 Jul 2026 or be in service by 31 Dec 2027. Consumer EV and home-energy credits ended in late 2025 and mid-2026. Hydrogen projects must begin construction before 2028. Nuclear, storage, geothermal, carbon capture and manufacturing kept most of their credits, but under new "prohibited foreign entity" rules aimed at Chinese supply chains. Around the tax code sit the regulators: FERC on wholesale markets and transmission, the NRC on nuclear, the EPA on emissions, the Interior Department on federal lands and offshore wind, and the state commissions on utilities and retail rates. Permitting law (NEPA) decides how long anything takes. Europe pursued a different path, with carbon pricing and mandates (the Green Deal, REPowerEU after Russia's invasion, the ETS and the carbon border adjustment). China pursued a third, with planned industrial policy that built most of the world's clean-energy supply chain. This section explains each regime, what changed in 2025–26, how a project developer or investor models policy risk, and how an experienced policy lead reads the next move.+ 1 exhibit19Geopolitics, OPEC, Russia and Energy SecurityEnergy is the one commodity that governments treat as a weapon, a shield and a budget all at once. Since the Arab oil embargo of October 1973, every major shock to the industry has had a political trigger: the Iranian revolution (1979), Iraq's invasion of Kuwait (1990), the Saudi–Russian price war of March 2020, Russia's invasion of Ukraine and its gas cut-offs to Europe (2022), and in 2026 the war with Iran, which effectively closed the Strait of Hormuz from early March and pushed Brent above $115/bbl in March and to a reported high of $126.41/bbl on 30 April 2026, its highest since 2022. Producer governments manage supply through OPEC (founded 1960) and, since December 2016, the wider OPEC+ alliance with Russia, using spare capacity held mainly by Saudi Arabia as their lever; the alliance lost the United Arab Emirates, which left OPEC and OPEC+ on 1 May 2026 (reported). Consumer governments answer with strategic stocks (the IEA system, created 1974), sanctions (the G7 price cap on Russian oil from December 2022, the EU's lower "dynamic" cap of $44.10/bbl from February 2026, and US blocking sanctions on Rosneft and Lukoil from 22 October 2025), new supply routes (above all US LNG) and, increasingly, industrial policy to escape China's dominance of clean-energy supply chains. This section explains how energy security works as a business variable: who holds the levers, how shocks move prices and company values, what sanctions actually do to flows and discounts, where the chokepoints are, how LNG changed gas security, and how an experienced analyst reads the next crisis. Prices are given with their benchmark and date; volumes in million barrels a day (mb/d), billion cubic metres (bcm) and million tonnes a year (Mtpa) of LNG.+ 2 exhibits20Critical Minerals and Clean Energy Supply ChainsAn oil economy runs on a fuel that is burned and bought again; a clean-energy economy runs on equipment that is built once from metals, and the metals are the new chokepoint. An EV uses roughly six times the minerals of a conventional car and an onshore wind farm several times the minerals of a gas plant of the same capacity (IEA, 2021). The metals that matter are lithium, nickel, cobalt, graphite and manganese for batteries; copper and aluminium for every wire and grid; rare earths for the permanent magnets in EV motors and many wind turbines; silicon and silver for solar; and uranium for reactors. Their mining is spread across Australia, Chile, Argentina, the Democratic Republic of Congo (DRC), Indonesia and others, but their processing is concentrated in China, which refines ~60–70% of lithium, ~75% of cobalt, over 90% of battery-grade graphite and ~90% of separated rare earths (IEA, 2024–25, reported). The 2021–22 boom took Chinese lithium carbonate to ~CNY 600,000/t (~$80,000/t) in November 2022, and the 2023–25 bust took it below CNY 80,000/t (~$10,000/t) by mid-2025, bankrupting or idling Western projects before a 2026 rebound to ~CNY 200,000/t in May 2026 (reported). Indonesia used an ore-export ban to become over half of world nickel supply; the DRC halted cobalt exports in 2025 to push prices up; China imposed and then partly suspended export controls on rare earths and battery materials. The US and EU responded with tax credits, price floors, equity stakes, tariffs and minerals deals. This section explains the minerals one by one, the price cycle, why processing rather than mining is the bottleneck, the policy responses, and how an experienced buyer, investor or developer reads mineral risk. Prices are given with their benchmark and date: lithium carbonate in CNY or $ per tonne (China spot or Guangzhou Futures Exchange), nickel and copper in $/t on the LME, cobalt in $/lb, uranium U3O8 in $/lb, NdPr oxide in $/kg.21History of Energy as a BusinessThe modern energy business began twice in the same quarter-century. On 27 August 1859 Edwin Drake's well at Titusville, Pennsylvania, struck oil at 69½ feet, and within twenty years John D. Rockefeller's Standard Oil refined most of America's kerosene. On 4 September 1882 Thomas Edison's Pearl Street station in lower Manhattan began selling electricity, and within fifty years Samuel Insull had shown that the way to make power cheap was to build large central stations, serve everyone, and accept regulation as a monopoly. Almost every business model in energy since then is a variation on those two templates: control the bottleneck in a commodity chain (Standard Oil's refineries and pipelines, the Seven Sisters' concessions, OPEC's spare capacity, China's processing plants), or build a capital-intensive network and earn a regulated return on it (Insull's holding companies, today's utilities). The history in between is a sequence of shifts in who captured the value: from oil companies to producer states in the 1970s; from regulated monopolies to competitive markets from the late 1970s; from conventional producers to shale in 2008–2019; and from fuel to equipment as solar, wind and batteries fell in cost by roughly 90% between 2010 and 2023. This section tells that history as a business story, with the decisions, prices and failures that set each era's rules, and draws out the patterns an experienced energy executive or investor carries into the present. Prices are nominal unless stated; oil in $/bbl, power in ¢/kWh or $/MWh, modules in $/W (DC).22Energy Failures, Disasters and BubblesEnergy fails in two ways, and the two are related. The first is corporate failure: a company whose costs, contracts, capital or licence could not survive contact with the market. Enron (bankrupt 2 Dec 2001) was a trading and accounting machine with no durable cost advantage. Solyndra (Sep 2011) bet a $535m federal loan guarantee against a falling polysilicon price. SunEdison (21 Apr 2016) financed growth with yieldco equity that was only cheap while its share price rose. Better Place (2013) built a battery-swapping network no second carmaker joined. Northvolt (US Chapter 11 Nov 2024, Swedish bankruptcy Mar 2025) raised more than $13bn (reported) and still could not get its factory yields up. Nikola (Chapter 11 Feb 2025) sold a story before a truck. SunPower (Chapter 11 Aug 2024) and its residential peers broke when interest rates and California's net-metering rules changed together. Chesapeake (Chapter 11 28 Jun 2020) and hundreds of shale producers borrowed against a price that did not hold. The second is operational disaster: Piper Alpha (167 dead, Jul 1988), Exxon Valdez (Mar 1989), Chernobyl (Apr 1986), Deepwater Horizon (11 dead, Apr 2010), Fukushima Daiichi (Mar 2011), San Bruno (8 dead, Sep 2010) and the Camp Fire (85 dead, Nov 2018). Disasters destroy the licence to operate and often the company: PG&E went into Chapter 11 in Jan 2019 with ~$30bn of wildfire liabilities (reported); BP's Deepwater Horizon bill passed ~$65bn pre-tax (reported). Around both sit bubbles: the 1970s–80s oil boom and bust, the California power crisis of 2000–01, clean-tech venture 1.0 (2006–11), uranium (2007), yieldcos (2014–15), the 2020–21 SPAC wave in EVs and hydrogen, lithium (2021–23) and the 2023 offshore-wind cost shock. This section explains how energy companies fail, walks through the main cases, asks what each cost and who paid, and sets out how an experienced investor, lender, regulator or operator reads the warning signs.+ 2 exhibits23Building and Running Energy Companies: Strategy, Capital Allocation and TalentRunning an energy company is mostly about deciding where to put capital in an industry where the asset outlives the management team, the price is set by a market nobody controls, and the licence to operate can be lost in an afternoon. The best operators do four things well. They allocate capital counter-cyclically: they buy assets and build when others cannot, and return cash when prices and valuations are high. They match strategy to their real advantage: low-cost barrels, a regulated rate base, a contracted pipeline, a cost-leading factory, a software platform. They treat safety and reliability as a management system, not a slogan. And they build and keep scarce talent: petroleum, reservoir and nuclear engineers, grid planners, traders and, increasingly, the electricians, lineworkers and welders whose shortage now limits the build-out. This section covers capital allocation through the cycle (reinvestment rates, buybacks versus growth, M&A at the top and bottom); the oil majors' transition pivots and retreats from 2020 to 2025 (BP, Shell, TotalEnergies, Equinor against ExxonMobil and Chevron); activism and governance (Engine No. 1 at Exxon in May 2021, Elliott at BP and Phillips 66 in 2025, Mantle Ridge at Air Products in 2025); how regulated utilities and independent power producers grow; safety culture; talent and craft labour; and the start-up paths (hardware, project development, software) for founders entering the industry.24Energy Access and Emerging Markets: AfricaAbout 666 million people had no electricity in 2023, and ~565 million of them (85%) lived in sub-Saharan Africa, according to the 2025 *Tracking SDG7* report by the IEA, IRENA, UN, World Bank and WHO. The region connected ~35 million people that year, but population growth cancelled most of the gain: the number without power fell by only ~5 million. Some two billion people worldwide still cooked with polluting fuels (verify latest figure). This is the energy industry's largest unmet market and its hardest business problem. The constraint is rarely the resource: Africa has some of the world's best solar, large hydro, gas and geothermal. It is the other three factors of the power equation. Route to market: national utilities that lose a quarter or more of their power to technical and commercial losses and cannot collect what they bill. Capital: borrowing costs two to three times those of advanced economies, in dollars, against revenue in currencies that depreciate. Licence: tariffs set politically below cost, fuel subsidies that are hard to remove, and contracts that governments renegotiate. This section covers the access numbers and how they are measured; off-grid solar and pay-as-you-go (PAYGo) finance (M-KOPA, Sun King, d.light); mini-grids; the finances of national utilities (South Africa's Eskom, Nigeria's privatised distributors, Kenya Power and the capacity charges owed to independent power producers (IPPs)); fuel-subsidy reform (Nigeria, May 2023); African oil and gas (Sonatrach, NNPC, Mozambique LNG, Dangote's refinery); the World Bank–AfDB Mission 300 programme to connect 300 million Africans by 2030; and a worked example set in Nigeria-like and Kenya-like markets.+ 1 exhibit

Energy Research Companion · Part II

100 companies, 885 strategic moves

A profile of each company, followed by its defining moves year by year from 1836 to 2026: what was decided, why, how it was financed, and what happened next.

Browse all 100 →

Audiobook & narrative editions

159 hr 20 min of narration

Both volumes are rewritten as narrative editions that read straight through, in long-form prose instead of tables. The audiobook is narrated from those editions as chaptered M4B files that play in Apple Books, VLC, BookPlayer and most audiobook apps.

  • The Book16 hr 29 min
  • Companion Volume 1 - Industry Studies22 hr 48 min
  • Companion Volume 2 - Companies A to M57 hr 53 min
  • Companion Volume 3 - Companies M to W and Timeline62 hr 10 min

Appendix C

Glossary: 92 terms

Read the full glossary →
1P, 2P, 3P
Proved; proved plus probable; and proved plus probable plus possible reserves, the low, best and high estimates, with at least a 90%, 50% and 10% chance of being met or exceeded.
45Q
The US tax credit for capturing and storing carbon dioxide; after the 2025 law, $85 per tonne for storage and for utilisation or enhanced oil recovery alike, and $180 per tonne for direct air capture, for projects that begin construction before 1 January 2033.
45U
The US production credit for existing nuclear plants, created by the IRA and kept by the 2025 law through 2032.
45V
The US clean-hydrogen production credit; after the 2025 law, available only to projects that begin construction before 1 January 2028.
45X
The US advanced-manufacturing production credit for domestically made solar, battery, wind and other components, transferable for cash; the 2025 law kept it for solar and batteries with a phase-down to 75% in 2030, 50% in 2031 and 25% in 2032, and ended it for wind components after 2027.
45Y and 48E
The technology-neutral US production and investment credits for clean electricity and storage that replaced the older PTC and ITC from 2025. After the 2025 law, wind and solar qualify only if construction begins by 4 July 2026 or the project is in service by 31 December 2027; storage and other technologies keep full credits for construction begun through 2033.
AD/CVD
Anti-dumping and countervailing duties: US tariffs imposed after trade cases find imports sold below fair value or subsidised, used repeatedly against Chinese and Southeast Asian solar cells and modules.
Allowed ROE
The return on equity a regulator permits a utility to earn on the equity-financed share of its rate base; about 9.77% on average for US electric utilities in 2025 (RRA).

From the blog

Read before you buy

All 7 articles →

The Power Equation

Learn the framework from the book. Test it against the companion.

Choose an edition

More in the series