The bullwhip effect is the way small changes in what consumers buy turn into much larger swings in orders as you move up a supply chain, from retailer to wholesaler to factory. Each company orders sensibly based on the orders it receives, adds a safety margin and reacts to its own forecast, and the swings grow at every step. A 30% rise in demand at the checkout can become a fivefold spike at the factory, followed by weeks with no orders at all.
The pandemic years showed it at national scale. In 2021 American shelves emptied and retailers ordered everything they could get. On 7 June 2022 Target warned that it would cut prices and cancel orders to clear excess inventory. Walmart's inventory in its first quarter of fiscal 2023 was up about 33% year on year, and Nike's about 44% at the end of August 2022 (reported). Consumers had shifted back to services. The goods ordered in the panic arrived anyway.
What is the bullwhip effect?
Picture a whip. A small flick of the wrist becomes a large crack at the tip. In a supply chain the wrist is the consumer and the tip is the factory, or the factory's suppliers, or the trucking companies and warehouses that move their goods.
The key insight is that orders are not demand. Each tier of a supply chain sees only the orders of the tier below it, not what consumers actually bought. A wholesaler that sees its retail customers order 50% more does not know whether shoppers bought 50% more, or bought 10% more while the retailer rebuilt its safety stock and padded its order in case of shortages. It treats the order as a signal, adds its own cover and orders more from its supplier. By the time the signal reaches the factory, it has been amplified several times.
The idea is old. Jay Forrester demonstrated it in simulations at MIT in the late 1950s. John Sterman's analysis of the Beer Distribution Game, published in 1989, showed that people running a four-stage chain create large oscillations even when consumer demand is steady. Hau Lee, V. Padmanabhan and Seungjin Whang gave it its name in 1997 and cited Procter & Gamble's observation that orders for Pampers diapers swung far more than babies' consumption did.
What causes the bullwhip effect?
The standard list has four causes. The research behind The Flow Equation adds a fifth.
| Cause | How it amplifies orders | What reduces it |
|---|---|---|
| Demand-signal processing | Each tier forecasts from incoming orders and reads a small rise as a trend | Share point-of-sale data; forecast from consumer demand |
| Order batching | Weekly or monthly orders in full trucks or containers create lumpy demand upstream | Smaller, more frequent orders; mixed loads |
| Price fluctuations | Promotions and trade deals encourage forward buying | Everyday low pricing; trade-deal reform |
| Rationing and shortage gaming | When supply is short and allocated by order size, customers over-order and cancel later | Allocate on past sales, not current orders; penalize cancellations |
| Lead times and human reaction | Longer lead times raise the amount each tier orders; people under-count stock already on order and overreact | Shorter, more reliable lead times; ordering rules that count the pipeline |
The last cause matters most for global supply chains. In 2021, lead times on some Asia lanes stretched from about six weeks to three or four months. Retailers ordered earlier and more, sometimes from several suppliers at once, and some chartered their own ships. Every one of those choices made sense for the company making it. Together they built the glut of 2022.
A bullwhip effect example, step by step
The industry study behind the book runs a stylized simulation of an invented product, a kettle, through four tiers: a retailer, a wholesaler, a distributor and a factory. Each tier uses a reasonable rule. It forecasts the orders it receives with exponential smoothing and orders enough to bring its inventory up to a target that covers its lead time plus a week and a half of safety stock. The rule even counts goods already on order, which is better practice than many real planners manage. Then consumers buy 30% more for sixteen weeks, fade back, and settle a little below the old normal.
| Week | Consumer demand | Retailer orders | Wholesaler orders | Distributor orders | Factory orders |
|---|---|---|---|---|---|
| 10 | 1,028 | 1,067 | 829 | 592 | 1,596 |
| 20 | 1,304 | 1,579 | 814 | 640 | 276 |
| 21 | 1,306 | 1,528 | 2,112 | 650 | 278 |
| 22 | 1,286 | 1,446 | 1,908 | 3,149 | 369 |
| 23 | 1,298 | 1,436 | 1,677 | 2,554 | 5,174 |
| 40 | 1,088 | 1,005 | 641 | 659 | 0 |
The surge reaches each tier a week later and larger. Consumers buy 30% more. The retailer orders 58% more. The wholesaler roughly doubles its orders, the distributor roughly triples them, and the factory receives orders about 5.2 times normal in week 23. Then the stock ordered in the panic arrives. Total stock in the chain peaks at about 2.5 times its starting level in week 41, just as consumer demand fades, and the factory receives no production orders at all in seven of the weeks between 36 and 79.
Consumers were never short. The retailer's safety stock absorbed the surge. All of the damage happened upstream. Measured over the whole run, the variability of orders grows from about 1.4 times consumer demand's at the retailer to about 6.3 times at the factory. And it is all produced by sensible local rules, not by careless people.
How do you reduce the bullwhip effect?
The same simulation tests the standard cures, which makes it possible to rank them.
| Scenario (stylized) | Factory order variability vs consumer demand | Factory peak order |
|---|---|---|
| Base case: surge and fall | 6.3× | 5,174 |
| Every tier forecasts from shared point-of-sale data | 2.1× | 2,098 |
| Lead times cut to one week at every tier | 3.8× | 3,327 |
| Smoothed ordering: close one-third of the gap each week | 3.3× | 2,360 |
| Point-of-sale data, smoothing and one-week lead times together | 1.5× | 1,523 |
| Base case plus phantom orders when suppliers are short | 7.8× | 5,177 |
| More reactive forecasting | 17.3× | 16,774 |
Four lessons follow.
Shared demand data is the single best fix. When every tier forecasts from what consumers buy instead of from its customer's orders, the factory's swing falls by about two-thirds. That is the logic behind the continuous-replenishment partnership Walmart and P&G built in the 1990s, and behind everyday low pricing, which removed the promotions that encouraged forward buying.
Lead time is inventory. Shorter lead times nearly halve the factory's swing on their own. The nearshoring argument is partly a bullwhip argument: a supplier a truck ride away needs far less stock in the pipeline and far smaller corrections than one a month away by sea. Our guide on how to calculate landed cost shows the other side of that trade.
Patience is cheap. Closing a third of the gap between target and actual stock each week, instead of all of it, halves the factory's swing for slightly more stock in the chain. It is the planning equivalent of not slamming the brakes.
Gaming and overreaction make it worse. Inflating orders when suppliers are short, the 2021 behavior, raises peak stock and the factory's backlog. Doubling the weight a forecast puts on last week's orders triples the factory's peak order. A capacity cap at the factory does not dampen the whip either. It hides it in a backlog, which is roughly what chipmakers and carmakers experienced in 2021–22.
Can one company bullwhip itself?
Peloton is the case the book uses for the bullwhip inside a single company. In 2020 demand for its bikes and treadmills surged and customers waited weeks for delivery. It bought the fitness-equipment maker Precor in 2021 for about $420 million (reported), began building a factory in Ohio and ordered heavily from Asian contract manufacturers. Then the Tread+ treadmill was recalled on 5 May 2021, gyms reopened and the inventory ordered for the peak arrived. Peloton's fiscal 2022 restructuring charges were about $611 million, including about $374 million of asset write-downs, and its connected-fitness gross margin in the fourth quarter of fiscal 2022 was −98.1% (company filings, reported). It abandoned the Ohio plant and outsourced manufacturing. It took until the year to 30 June 2026 to report a first full-year net profit, $63.2 million on revenue of about $2.45 billion (company).
Why the bullwhip matters for logistics companies
Freight carriers, brokers and warehouse developers sit upstream of retailers' orders, so they ride a whip they cannot see. The goods boom of 2021 filled every truck and warehouse. The destocking of 2023 emptied them, and the US trucking market entered a freight recession that lasted into 2025. Companies that extrapolated 2021 volumes, by buying trucks, raising venture money or leasing buildings, discovered they had been riding the bullwhip, not a structural change. Our case study of why Convoy failed is one result. Capacity decisions should be judged against consumer demand, not orders: a factory or carrier that added capacity to meet the week-23 order in the simulation would have built five times normal capacity for a surge that was 30% at the till.
The bullwhip and the flow equation
The Flow Equation argues that value depends on four factors that multiply: cost to serve, density, reliability and capital matched to the cycle. The bullwhip is one of the two outside forces the book treats like weather, amplifying the freight and inventory cycles. It hits two factors hardest. It raises cost to serve through excess stock, markdowns and emergency freight, and it tests capital matched to the cycle, because inventory is cash, and a glut ties up money exactly when sales slow. Data sharing and shorter lead times improve both. The full treatment is in the industry study of inventory planning, forecasting and the bullwhip, and the wider industry picture is in our guide to the logistics industry business model.
The takeaway
The bullwhip effect is not a failure of intelligence. It is what happens when every company in a chain plans sensibly from the orders it sees rather than the demand that matters. Its causes are known, and so are its cures: shared point-of-sale data, shorter and more reliable lead times, patient ordering rules and allocation that does not reward phantom orders. The businesses furthest upstream feel it most, which is why freight and warehousing booms so often end in busts. Chapter 14 of The Flow Equation follows the bullwhip from Peloton's factory to the balance sheet.
Frequently asked questions
Who discovered the bullwhip effect?+
Jay Forrester showed the pattern in industrial-dynamics simulations at MIT in the late 1950s. Hau Lee, V. Padmanabhan and Seungjin Whang named it and set out its four standard causes in 1997 papers that cited Procter & Gamble's experience with Pampers orders.
What is the beer game?+
The Beer Distribution Game is a classroom simulation from MIT in which four players run a retailer, wholesaler, distributor and factory. John Sterman's 1989 analysis showed that players produce large swings in orders and stock even when consumer demand barely moves.
Is the bullwhip effect the same as a supply shortage?+
No. A shortage is a lack of goods; the bullwhip is the amplification of orders as they move upstream. Shortages often trigger it, because customers over-order when supply is rationed and cancel later, which makes the swing worse.
Does the bullwhip effect affect freight and trucking companies?+
Yes, heavily. Carriers, brokers and warehouse developers sit upstream of retailers' orders, so they see swings several times larger than consumer demand. Much of the 2021 freight boom and the 2022–25 freight recession reflected inventory orders rather than consumption.
Go deeper in The Flow Equation
Chapters
Industry studies
Company profiles
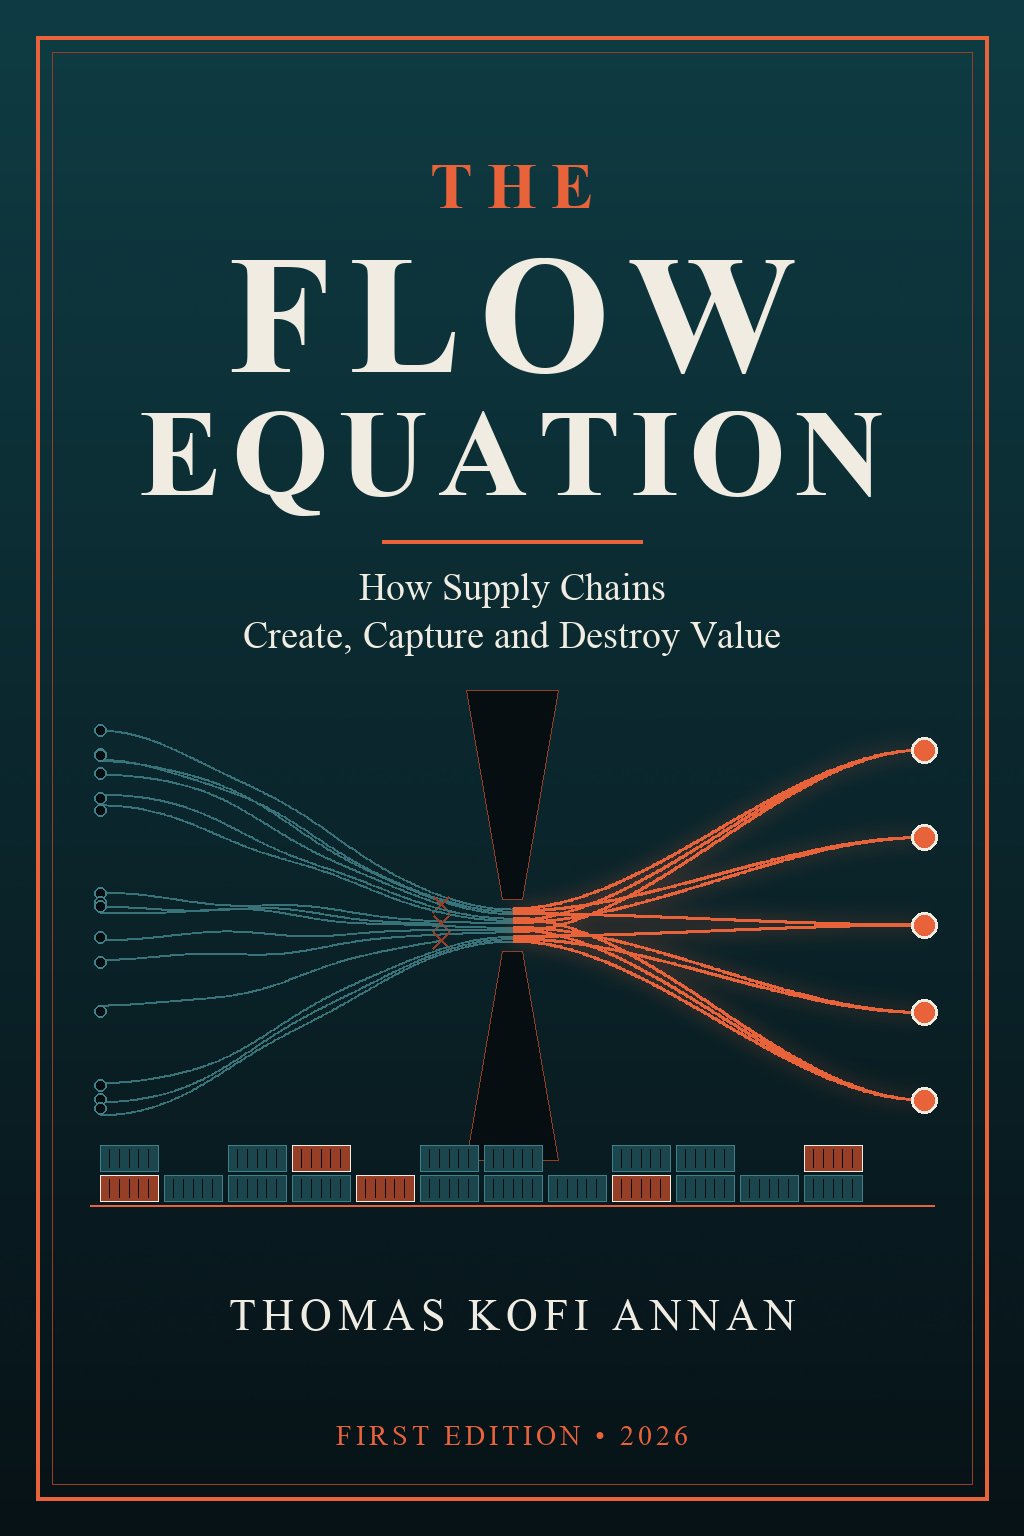
From the research behind The Flow Equation
How Supply Chains Create, Capture and Destroy Value
25 chapters, 24 industry studies, 100 companies and 848 strategic moves.
See the bookEducational content, not investment, legal, tax, medical or engineering advice. Figures marked “reported” come from filings and published sources that have not been independently audited.