The edtech business model is an answer to one question: who pays, out of which budget, and why will they pay again next year? Education companies make money from five main sources: consumer subscriptions, institutional licenses sold to schools, universities and employers, shares of tuition, marketplace commissions, and government contracts. Which one a company uses decides its margins, its sales costs and how it dies when things go wrong.
Two US companies show the range. Duolingo keeps its lessons free, sells a subscription to a small share of users, and passed $1 billion of revenue in 2025 ($1,037.6 million, up 39%). Chegg also sold a consumer subscription to students, peaked at about $776 million of revenue in 2021, and fell to $376.9 million in 2025 after free AI chatbots gave away the answers it charged for. Same payer, same pricing mechanism, opposite outcomes. The difference was in the parts of the business model that sit below the price tag.
This guide walks through those parts: the market, the payer models, pricing, unit economics, margins, distribution, evidence, and the policy and capital cycles that move the whole sector.
How big is the education technology market?
Education is one of the largest spending categories in any economy, and that size has misled investors for two decades. HolonIQ's long-running estimate puts global education and training spending at roughly $6–7 trillion, of which only a low single-digit percentage is digital. Market-research estimates of the "edtech market" for the same year range from about $150 billion to more than $400 billion, depending on what is counted.
The US numbers are more concrete. Public K-12 spending is on the order of $900 billion a year. US organizations with 100 or more employees spent a reported $102.8 billion on training in 2025, most of it on internal payroll rather than vendors. About 49 million public-school students sit in about 13,000 districts. There are roughly 3,900–4,000 degree-granting colleges and universities.
The gap between total spending and digital spending looks like an opportunity. Most of it is not. Education money pays mainly for teachers and buildings, flows through public budgets set by law and politics, and moves on annual fiscal cycles. A product does not capture a share of that spending by being better. It has to fit a budget line that someone is willing to renew.
Why is edtech harder than ordinary software?
Most software is judged by whether people use it and pay for it. Education technology has three additional problems, and most failures trace to at least one of them.
The learning problem is that use is not learning. Learners are poor judges of their own progress, and the techniques that build durable memory, such as retrieval and spacing, feel slower and harder than re-reading. A product tuned for enjoyment drifts toward methods that work least well.
The buyer problem is that the person who learns is rarely the person who pays. In US K-12 the student never pays. In higher education the student pays, often with federal grants and loans. In workforce learning the employer pays. A teacher may choose a tool, a curriculum office may approve it and a business office may pay for it, each with its own idea of value.
The evidence problem is that it is hard to show a product caused any learning. Students grow anyway, by roughly 0.4–0.6 standard deviations a year in upper elementary school. Heavy users of a product tend to be more motivated students. And real effects are small: an analysis of 141 large, rigorous education trials found an average effect of about 0.06 standard deviations.
| Dimension | Typical software business | Education technology |
|---|---|---|
| User and payer | Same person, or the user's employer | Often different: student, teacher, district, parent, government |
| Value to the user | Felt immediately | Often delayed by months or years |
| Main source of money | Private budgets | Mostly public money in K-12 and higher education |
| Buying calendar | Continuous | Clustered around fiscal years, terms and exam dates |
| Proof of value | Usage and retention | Usage, retention and causal evidence of learning |
| Typical exit | IPO or strategic sale | Strategic sale or private equity; few successful IPOs |
None of this makes education a bad market. It means the arithmetic and the evidence have to be stronger than in markets where the user simply pays.
What is the learning equation?
The framework in The Learning Equation holds that a learning product creates durable value only when four things are true at once, and that the factors multiply rather than add. If any one is zero, the result is zero.
- Learning design. Does the product change what students know and can do, through a mechanism such as retrieval practice, feedback or practice at the right level?
- A willing payer. Who pays, from which budget, and will they pay again?
- An affordable route to that payer. Does reaching the buyer cost less than the buyer is worth?
- Evidence. Can the product be proven to the standard the buyer requires, whether that is a consumer's first annual renewal or a district's evidence tier?
Two forces sit around the equation like weather. Policy can create a market overnight or delete one. Capital cycles can flood the sector with money and then withdraw it. Neither changes whether a product works, but both change how long a company has to prove that it does. Chapter 1 sets out the framework in full.
The rest of this guide is mostly about the second and third factors, the business model proper. But every collapse in the sector's recent history shows a zero somewhere in the product.
Who pays? The four edtech payer models
Every edtech business sits in one of four payer models, and many large companies sit in several.
| Model | Who pays | Typical revenue unit | US examples | Core economic risk |
|---|---|---|---|---|
| B2C | Learner or parent | Subscription, course purchase, per-session fee | Duolingo, Chegg, MasterClass, tutoring marketplaces | Paid acquisition cost and motivation-driven churn |
| B2B | District, school, university, employer | Seat, per-pupil, site or enterprise license | Instructure, PowerSchool, Curriculum Associates | Long sales cycles, budget dependence, renewal on usage |
| B2B2C | Learner or institution through an intermediary | Revenue share; parent upgrade on a school product | Online program managers, Grand Canyon Education, ClassDojo, Guild | Partner dependence and regulatory scrutiny |
| B2G | State or federal government | Per-pupil funding, state contracts | Stride's virtual schools, state assessment vendors | Political and funding-formula risk |
The lines blur. Coursera has consumer, enterprise and degree segments. Khan Academy is free to learners, funded by philanthropy, and sells district partnerships. Quizlet and Kahoot run free products for teachers and students and sell school plans on top. The model matters because it decides who must be persuaded, how often, and with what proof. Our comparison of B2C vs B2B edtech works through the trade-offs in detail.
How do edtech companies price their products?
Inside each payer model sits a pricing mechanism. Each one has a characteristic failure.
| Mechanism | Where it fits | Watch-outs |
|---|---|---|
| Freemium | Consumer apps, teacher tools | Conversion is usually low single digits; free users cost hosting and now AI inference |
| Consumer subscription | Language, test prep, homework help | App-store fees of 15–30% sit in cost of revenue |
| Per-seat or per-pupil license | K-12 supplemental and assessment | Seat counts follow enrollment, which is falling in many US districts |
| Site, district or enterprise license | LMS, SIS, workforce platforms | Under-use invites contraction at renewal |
| Revenue share | Online degrees (historically 40–60% of tuition, reported) | Regulatory exposure and front-loaded costs |
| Marketplace take rate | Udemy, Wyzant, Preply | Learners and tutors leave the platform |
| Content adoption | Core curriculum | Lumpy, tied to state adoption calendars |
| Income-share agreement | Bootcamps, roughly 2017–22 | Treated by regulators as credit |
The last row is a warning. Lambda School sold "pay nothing until you're hired" contracts, and in 2024 the Consumer Financial Protection Bureau found that those contracts were loans and that its advertised placement rates of up to 86% compared with internal figures of around 50%. A pricing mechanism that reads as a product feature can turn out to be a legal category.
Consumer edtech: how the unit economics work
Consumer learning removes the institution. The learner or a parent pays directly, usually through a phone, and the product has to win attention every day against games and social media. The chain is the familiar one for any subscription business: customer acquisition cost (CAC), lifetime value (LTV) and payback. Four points are specific to learning apps.
Organic growth decides everything. Duolingo has said for years that most of its user growth is organic, and historically it spent about 10% or less of revenue on paid marketing. A worked example in the book makes the arithmetic plain: if an app buys installs at $2 each and 2% of installs become paying subscribers, each subscriber costs $100 to acquire, even though the install looked cheap. At $9 a month of net revenue and 6% monthly churn, that subscriber is worth only about $127 over a lifetime. The app barely earns back its marketing.
Retention dominates. LTV is roughly monthly contribution divided by churn, so cutting monthly churn from 6% to 4% raises lifetime value by half with no change in acquisition. The first annual renewal of an annual cohort is the single best indicator of product value.
App stores take a large share. Apple and Google charge 30% of first-year subscription revenue and 15% thereafter. After the 2025 Epic v. Apple ruling on anti-steering (reported), web checkout became a lever worth several margin points.
AI inference is a new variable cost. Conversational features consume model compute per use, so a heavy user of a flat-priced premium tier can cost more than they pay. Duolingo cited AI costs as one reason its gross margin slipped to 72.2% in 2025 from 72.8%.
Freemium conversion is low by design. Practitioner heuristics compiled in the book treat paid subscribers above about 9% of monthly users as strong and below 3% as weak, and Duolingo moved from about 3% in 2020 to about 8–9% by 2025 (reported). Our case study on how Duolingo makes money shows why that ratio only works when acquisition is nearly free.
Institutional edtech: districts, universities and employers
For software sold to institutions, the core metrics are those of any software-as-a-service business, with education-specific wrinkles.
| Metric | Meaning | Rough ranges (stylized, practitioner experience) |
|---|---|---|
| Annual contract value | Revenue per customer per year | Teacher or school plan $1–10k; district supplemental $10–150k; district core or infrastructure $100k–$1m+ |
| Gross revenue retention | Starting revenue less churn and contraction | Supplemental K-12 about 80–90%; core curriculum, SIS, LMS about 90–97% |
| Net revenue retention | Gross retention plus expansion | Supplemental about 90–110%; platforms with upsell about 100–115% |
| CAC payback | Months of gross profit to recover sales cost | 15–30 months is common for district field sales |
The wrinkles matter more than the definitions. Almost all US district contracts start on 1 July, so renewal risk bunches into a narrow spring window, and a missed renewal costs a year. Districts sometimes prepay several years to spend expiring funds, which flatters bookings and hides renewal risk. Districts keep a product but cut it back to the schools that use it. And per-pupil prices shrink as enrollment falls.
The deepest wrinkle is the difference between "must-buy" and "should-buy." Core curriculum is a must-buy: every district must teach reading and math, and the purchase is planned years ahead from general funds. Supplemental software is a should-buy: often valuable, but cuttable, and historically funded from soft money. Curriculum Associates moved from the second category toward the first with i-Ready, whose diagnostic embeds it in the district's assessment calendar. It reported revenue of "nearly $800 million" a year in 2024 (Boston Globe) without any venture capital.
Why one-time money is dangerous
Between 2020 and 2024 the federal government gave US schools about $190 billion of Elementary and Secondary School Emergency Relief (ESSER) funds, which had to be obligated by 30 September 2024. Vendors that sold against that money learned in 2024–26 that "annual" contracts paid from one-time funds behave like one-time sales. The practical habit the book recommends is simple: name the line item that pays for a product and ask whether it recurs. The general fund, Title I and a consumer subscription with a proven renewal recur. A pilot grant and ESSER do not. Our guide to selling edtech to school districts covers the funding sources and calendar in detail.
Revenue shares and marketplaces
Two business models sit between consumer and institutional sales, and both have a structural cap on margin.
An online program manager (OPM) traditionally paid up front for a university's online degree, covering marketing, recruitment and course production, in exchange for a share of tuition, historically about 40–60%, for seven to fifteen years. The contract behaves more like specialty finance than software. The university buys insurance against launch risk, and when a program succeeds it discovers how high the premium was. 2U built a public company on that contract and filed for Chapter 11 in July 2024. Our explainer on what an online program manager is covers the contract mechanics, and the 2U case study covers the collapse.
Marketplaces keep a take rate after paying instructors or tutors. Their gross margin is set by that take, which is why Coursera's 2025 gross margin was 54.6%, held down by content fees to its university and industry partners. Tutoring marketplaces also fight leakage: once a family trusts a tutor, both have a reason to move off the platform.
What gross margins do edtech companies earn?
Gross margin varies more by model than by company quality.
| Model | Typical gross margin (approximate) | Main cost of revenue |
|---|---|---|
| Consumer subscription app | About 70–80% | App-store fees, AI inference |
| K-12 or higher-ed software platform | About 65–80% | Hosting, support, implementation |
| Digital curriculum with print | About 50–70% | Print, content amortization, training |
| Content marketplace or MOOC platform | About 50–65% | Content fees and revenue shares |
| Human tutoring | About 35–70% | Tutor pay |
| Online schools and government services | Lower, often below 40% | Teachers and instructional staff |
Accounting classification moves these numbers. Marketplaces that report revenue net of payouts look more profitable than those that report it gross, so compare contribution margins after all variable costs. Gross margin is also a decision: services, human tutoring, AI inference and content fees are choices an operator prices deliberately.
How do edtech companies reach their buyers?
The third factor of the equation, the route to the payer, is where most edtech business models break. Each route has a cost and a cycle.
Organic consumer growth. Brand, word of mouth, app-store ranking and social media. Nearly free when it works, and the only route on which low freemium conversion pays.
Search traffic. Chegg's main channel. Students typed a textbook problem into Google and landed on a Chegg page with the answer behind a paywall. It worked for a decade and failed when Google began answering queries on the results page.
Teacher-first adoption. A teacher signs up free, colleagues in the same building follow, and usage data identifies districts worth a sales call. The book calls this "land with teachers, expand with districts," and it is now the default for classroom tools. Its limit is that teacher enthusiasm does not create budget.
Field sales to districts. Expensive and slow. A stylized pipeline in the research shows a nominal eight-month process stretching to almost ten months once the district fiscal calendar is included, and about 85% of wins closing between March and August.
Revenue-share partnerships. The OPM route, in which the vendor pays for marketing and takes a share of tuition.
Paid acquisition. Necessary at the margin for most consumer companies, dangerous as the main engine. Byju's in India showed the extreme version: an inside-sales force of thousands selling multi-year packages to parents, often financed with consumer loans.
The rule underneath all of these is that the route must cost less than the customer's lifetime value. That sounds obvious. It was ignored by most of the companies that failed in 2022–25.
Why evidence is now part of the business model
The fourth factor used to be optional. It is becoming a procurement requirement. The Every Student Succeeds Act of 2015 defines four tiers of evidence, from a randomized trial (Tier 1, "strong") to a research-based logic model (Tier 4). Some school-improvement funds require Tiers 1–3, and the relief-era requirement that districts spend at least 20% of ARP ESSER funds on evidence-based interventions pushed vendors to produce studies.
The tiers have limits. Tier 3 can be met with a vendor-commissioned correlational study, and the tiers say nothing about effect size or cost. Our guide to evaluating edtech efficacy claims explains how to read them. For consumer companies, the equivalent proof is the renewal: a subscriber who pays for a second year has decided the product works for them, whatever the research says.
How policy and capital cycles move the whole industry
Policy has moved more value in education than any product launch. The 2005 removal of the rule limiting federal aid to mostly-online institutions created the online-degree boom. A 2011 Department of Education guidance letter made OPM tuition-sharing legal at scale. China's July 2021 "double reduction" policy banned for-profit tutoring in core school subjects, and TAL, New Oriental and Gaotu lost about 90% or more of their peak value.
Capital cycles amplified the policy cycles.
| Year | Global edtech venture funding (HolonIQ) | What drove it |
|---|---|---|
| 2019 | About $7.0 billion | Pre-pandemic baseline |
| 2020 | About $16.1 billion | Remote learning; Chinese tutoring mega-rounds |
| 2021 | About $20.8 billion | All-time high; IPOs and mega-rounds |
| 2022 | About $10.6 billion | Rate shock; China removed |
| 2023 | About $3.0 billion | Down rounds and shutdowns |
| 2024 | About $2.4 billion | Lowest in about a decade |
| 2025 | About $2.6 billion (reported) | Small AI- and workforce-led rebound |
The boom of 2020–21 was a funding event more than a demand event. Generalist growth funds priced education companies on revenue growth and the public multiples of the moment, and many companies built cost structures for a market that was about to shrink. Our list of the biggest edtech failures traces how that played out, and Chapter 19 covers the cycle in depth.
How do edtech companies exit?
In education the exit has usually been a sale to private equity or a strategic buyer, not an IPO. Most of the 2021 listings traded far below their offer prices within eighteen months; Duolingo was the clear exception. Buyout firms, meanwhile, built some of the sector's largest businesses by buying school software and holding it through cycles.
PowerSchool is the reference case. Pearson sold the student information system to Vista Equity Partners in 2015 for $350 million, when it had about $97 million of revenue (reported). After more than fifteen acquisitions and a 2021 IPO, Bain Capital took it private in 2024 at an enterprise value of about $5.6 billion. Instructure followed a similar path, ending with a KKR take-private at about $4.8 billion in 2024.
The limit of that playbook is debt. Pluralsight's lenders took control in 2024, and Anthology, the owner of Blackboard, filed for Chapter 11 in September 2025. The book's test is blunt: before adding leverage, ask what happens if revenue falls 15%.
What does AI change about the edtech business model?
Generative AI changed costs on both sides. It cut the cost of producing content, exercises and new courses to near zero. Duolingo announced 148 AI-built courses in April 2025. It also added a new variable cost, inference, and new competitors in the model providers themselves, which now offer free study and tutoring modes.
The first casualty was any business that charged for answers. Chegg's shares fell about 48% on 2 May 2023 after management said ChatGPT was hurting new sign-ups. Our case study on what happened to Chegg covers the decline in detail. The book's view is that durable advantages now come from what the next model release does not provide: distribution into schools, curriculum alignment, proprietary learning data, teacher trust and evidence. Access to a model is not one of them. Our explainer on the AI tutoring business model works through inference costs against what districts actually pay.
How to read any edtech business in five questions
The pieces above compress into a short diligence list that works for a founder, an investor or a district buyer.
- Which budget line pays, and does it recur? If nobody can name it, the product is a nice-to-have.
- What does it cost to reach one more paying customer, and how long until that cost is repaid? Ask for the organic share of new users or the pilot-to-contract conversion rate.
- What is gross revenue retention, separate from net? Expansion can hide a leaking cohort.
- What evidence exists for the product as sold today, from whom, and at what effect size?
- What happens if a policy, a funding source or a free AI substitute removes one revenue line?
The takeaway
Education technology makes money in a handful of ways: consumer subscriptions, institutional licenses, tuition shares, marketplace commissions and government contracts. The model a company chooses decides who it must persuade, what reaching them costs, and how it fails. The companies that lasted, from Duolingo to PowerSchool, sat on budgets that renew and reached their payers cheaply; the companies that collapsed, from 2U to Byju's, depended on a channel, a regulation or a funding wave that went away. For the full arithmetic of payer models, pricing and margins, start with Chapter 4 of The Learning Equation.
Frequently asked questions
What is the most profitable edtech business model?+
Systems of record sold to institutions, such as student information systems and learning management systems, have the most durable economics, with gross revenue retention commonly above 90% and decade-long customer lives. Consumer subscriptions can be just as profitable when most users arrive organically, as Duolingo shows, but few companies achieve that.
Is edtech a B2B or B2C business?+
Both, and often both inside one company. The research behind The Learning Equation sorts edtech into four payer models: consumers (B2C), institutions (B2B), institutions or learners reached through an intermediary (B2B2C), and governments (B2G). Coursera, for example, sells to consumers, employers and universities at once.
Why do so many edtech startups fail?+
Most failures trace to a gap between the user and the payer, a sales route that costs more than the customer is worth, or revenue that depended on one-time money such as pandemic relief funds. Bad software is rarely the main cause.
How big is the edtech market?+
Estimates vary with the definition. HolonIQ puts global education and training spending at roughly $6–7 trillion, of which only a low single-digit percentage is digital, and market-research estimates of the edtech market itself range from about $150 billion to more than $400 billion.
Go deeper in The Learning Equation
Chapters
Industry studies
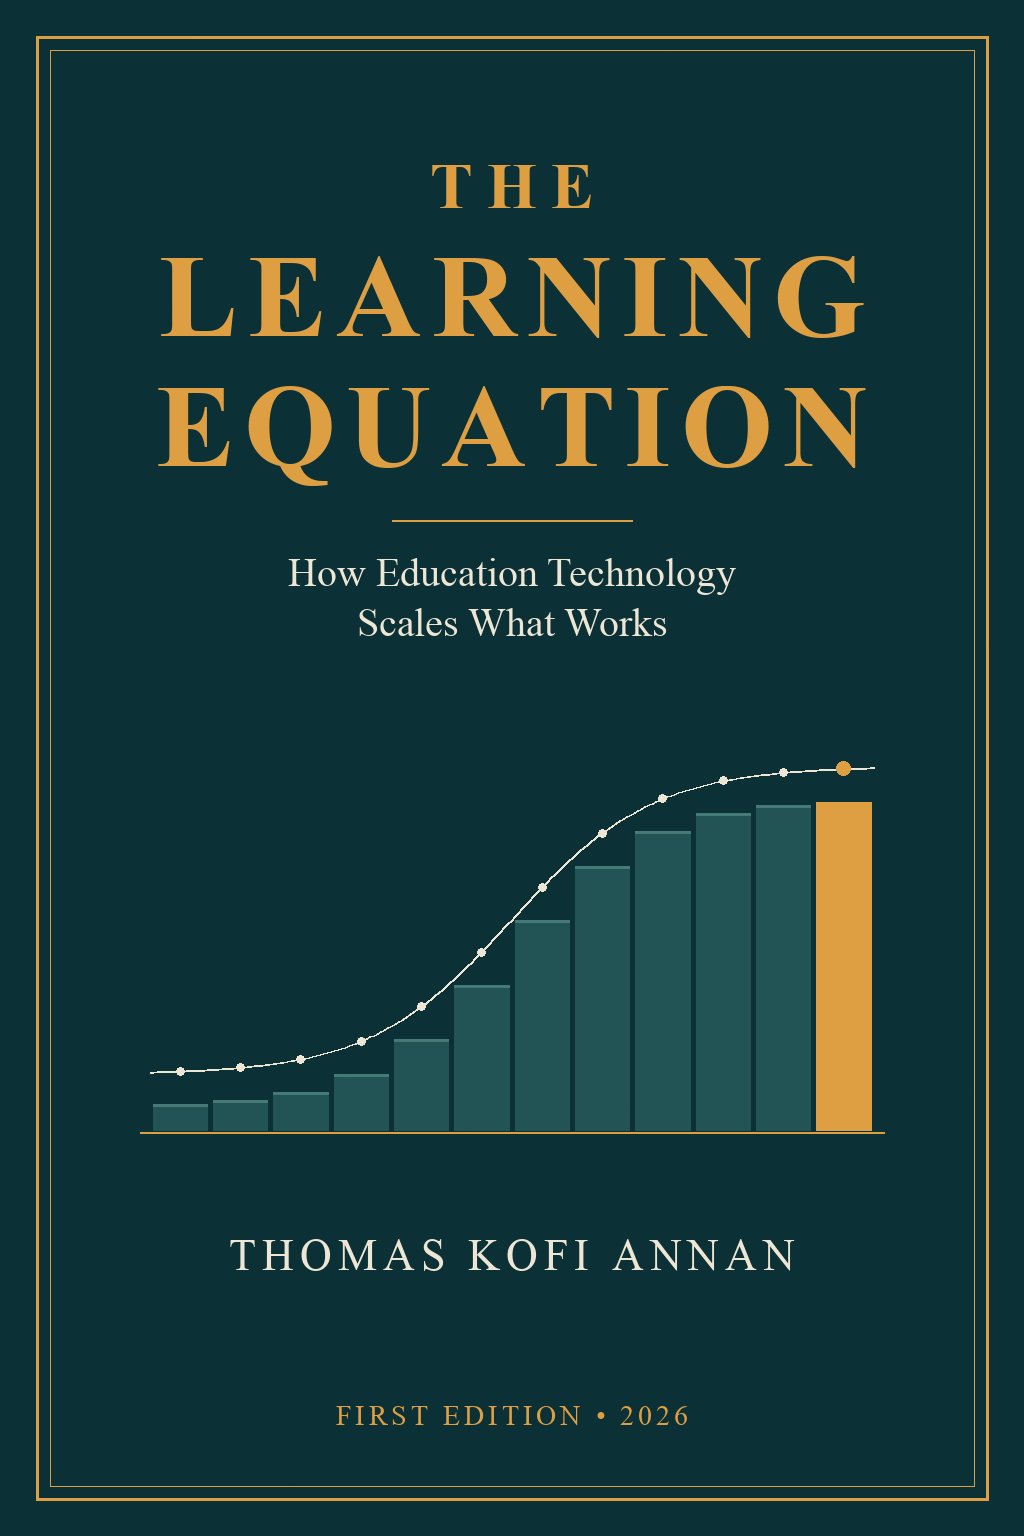
From the research behind The Learning Equation
How Education Technology Scales What Works
25 chapters, 23 industry studies, 100 companies and 847 strategic moves.
See the bookEducational content, not investment, legal, tax, medical or engineering advice. Figures marked “reported” come from filings and published sources that have not been independently audited.